Quick Summary
Mangrove Forest of Everglade our impacted regular by powerful hurricane. Using traditional and new age remote sensing technology we are studying how to asses hurricane impacts and recovery of mangrove forest.
|
About
Mangrove forests located in Everglades National Park (ENP) are the largest mangrove forests in continental North America. These forests provide important ecosystem services, including mitigation of large storms, coastline stabilization, habitat for many species (some which are vulnerable and endangered), and carbon storage. The degradation or loss of mangroves would lead to the loss of these beneficial ecosystem services and possibly lead to the degradation in health of the overall Everglades ecosystem. Assessing the damage and recovery of these forests following a large disturbance is important due to the many ecological benefits they provide. The most recent large disturbance to hit the Everglades region was Hurricane Irma, which made a landfall in September of 2017 as a category 3 hurricane and created extensive damage to many sections of Florida.
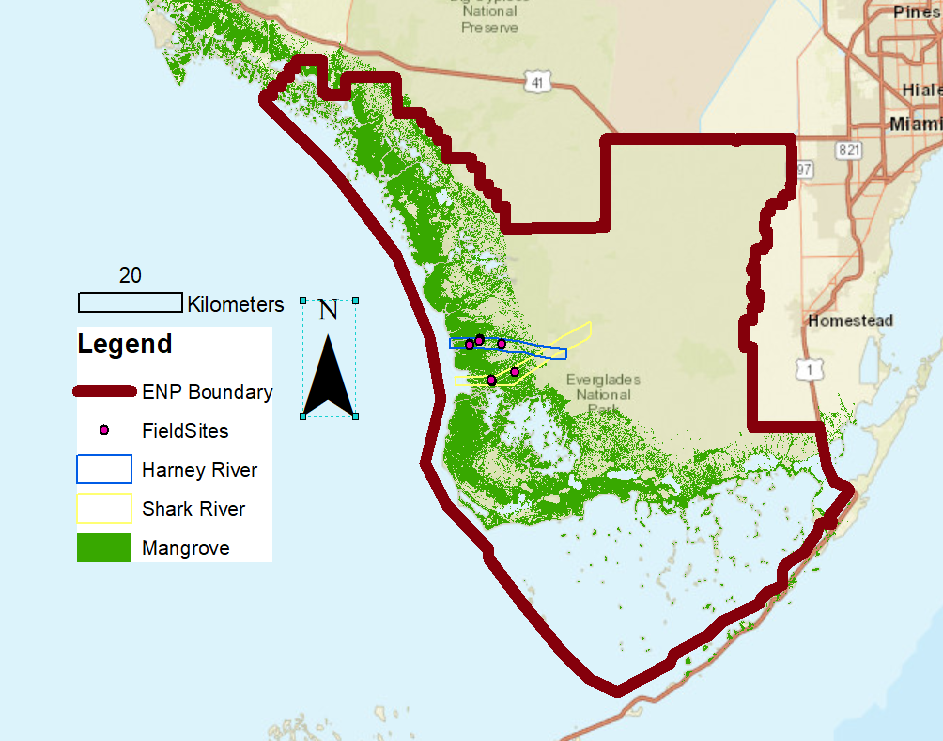
Our current study area encompasses the mangrove forests within ENP, which is estimated to cover an area of about 224,579 hectares (Figure1b) and includes three mangrove types: Red mangroves (Rhizaphora mangle), Black mangroves (Avicennia germinans), and White mangroves (Laguncularia racemosa). The South Florida Region is historically known to be impacted by tropical storms and hurricanes. Since the year 2000, the state of Florida has been hit by more than 38 powerful storms. As this area is often affected by powerful hurricanes, it is an ideal area for studying the impact of hurricane disturbance on mangrove forests and study their recovery overtime. Although mangrove help protect coastal communities from large and destructive storms events, mangroves themselves can be highly damaged by such storms. Damage to mangroves includes defoliations, broken branches, snapped and fallen trees, as well as SDB. Large branches and fallen trees that accumulate on the forest ground are defined as CWD, which is very important in wetland ecosystems, including mangrove forests, as CWD material provides food and habitat for a range of organisms and helps with recycling and
introducing nutrients within local ecosystems. In addition, CWD can be used as an indicator for hurricane damage, since CWD is mostly commonly made up of fallen large branches, twigs, and
fallen trees, which are also example of common hurricane damages to mangroves. Increases in CWD found on ground following a hurricane can indicate the amount of volume lost within a mangroves canopy. Another indicator for damage is SDB, which is also important to the ecosystem, as it becomes food and habitat sources for different organisms. Overtime, as tree breaks down, SDB will eventually fall to the ground and become CWD.
Our research relies on two datasets: 1) Point cloud data acquired by a new generation Lidar (Light Detection and Ranging) instrument and 2) multispectral data acquired by space-borne optical remote sensing instruments. Each dataset provides a different measure of the mangrove forest at different stages of damage/recovery by hurricane Irma. Thus, these datasets complement one another in providing a more complete understanding of mangrove forests response to hurricane-induced disturbances and tracking recovery overtime.
Methods
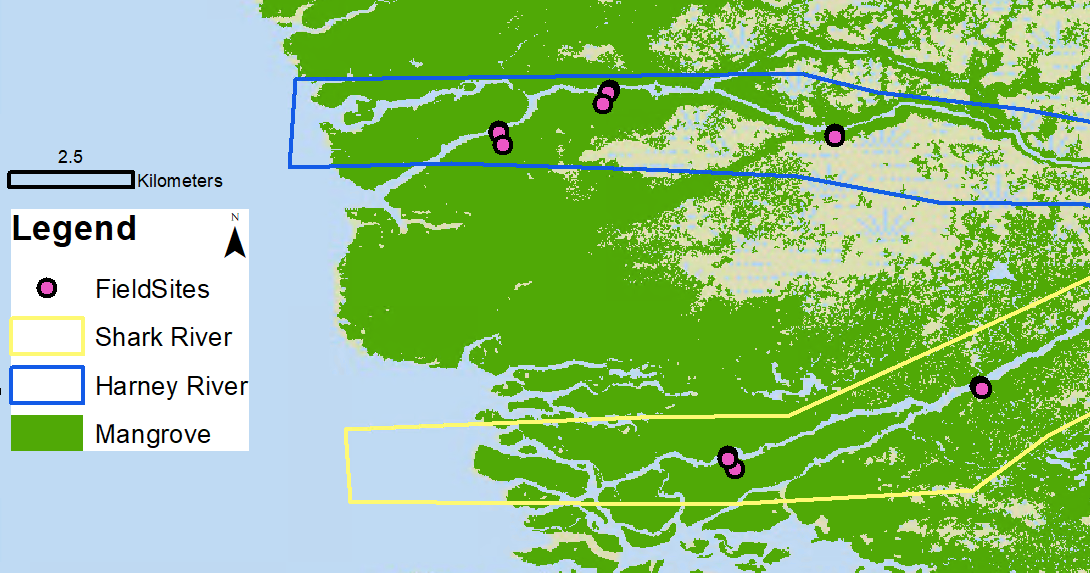
Using the difference in point returns, along with products derived from G-LiHT, estimates in changes and trends in mangrove forests structure before and after storm events can be established. This relationships between changes in mangrove structures and changes in data derived from G-LiHT would allow me to estimate canopy loss, and model CWD and SBD using multi regression models. The regression model will be calibrated using data from a rapid field assessment conducted in January 2018 by team of scientist from Florida International University. This rapid field assessment established 13 different 10x10 meter plots along the Harney and Shark River to determine forest structure following Hurricane Irma. Data collect from the field assessment included mean CWD and volumes of SBD and each of these plots has corresponding G-LiHT data. Field data will be used to calibrate regression models to model CWD and SDB and be used to expand model to different areas with available G-LiHT in Everglades.
NDVI serves as an indicator for how green vegetation which is also an indicator for vegetations health. It is calculated using the Near Infrared (NIR), which is found within 7.85-9.0 micrometers within the visible spectral range and Red spectral band which is found between 6.60-6.80 micrometers. NDVI values are normalized and cover the range between -1 and 1 (Equation 1). In theory, healthy mangroves should have an NDVI value of around 0.8-0.9, while unhealthy or disturbed mangrove have a much lower NDVI value possibly around 0, if vegetation is removed from the study area. After the disturbance, NDVI value would gradually increase overtime, as tree recovers or grows back. NDVI values will be calculated by obtaining cloud free imagery from Landsat 8 starting from April 2013 and collected periodically overtime and then calibrated using NDVI values collected from imagery obtained from MODIS, WorldView-2, and Sentinel-2. Calculated NDVI values will be used to create an NDVI time series and determine changes in NDVI before and after hurricane Irma. By analyzing changes in NDVI values following a disturbance and also comparing that to NDVI trend before a disturbance, we can use the NDVI time series to determine the recovery of mangrove within our study area.
Data
Data for this study is publicly available. All Landsat data can be found at https://earthexplorer.usgs.gov/
and lidar datasets can be found at https://gliht.gsfc.nasa.gov/
Study Area Maps
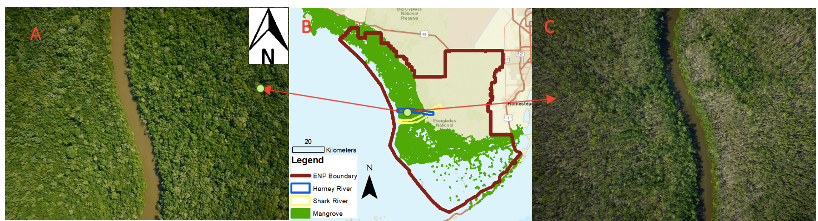
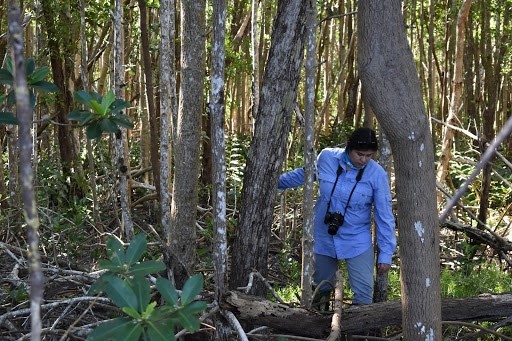
Hurricane-induced damage to the mangrove forest of southwest Florida as observed by high-resolution aerial imagery. (A) Mangrove forest patch along Shark River taken in March 2017. (B) Location map of mangroves in southwest Florida, within the Everglades Nation Park boundary, and G-Light swaths along the Harney and Shark Rivers. (C) Mangrove forest patch along Shark River taken in December 2017 after Hurricane Irma. Both Images were taken from the G-LiHT data portal.
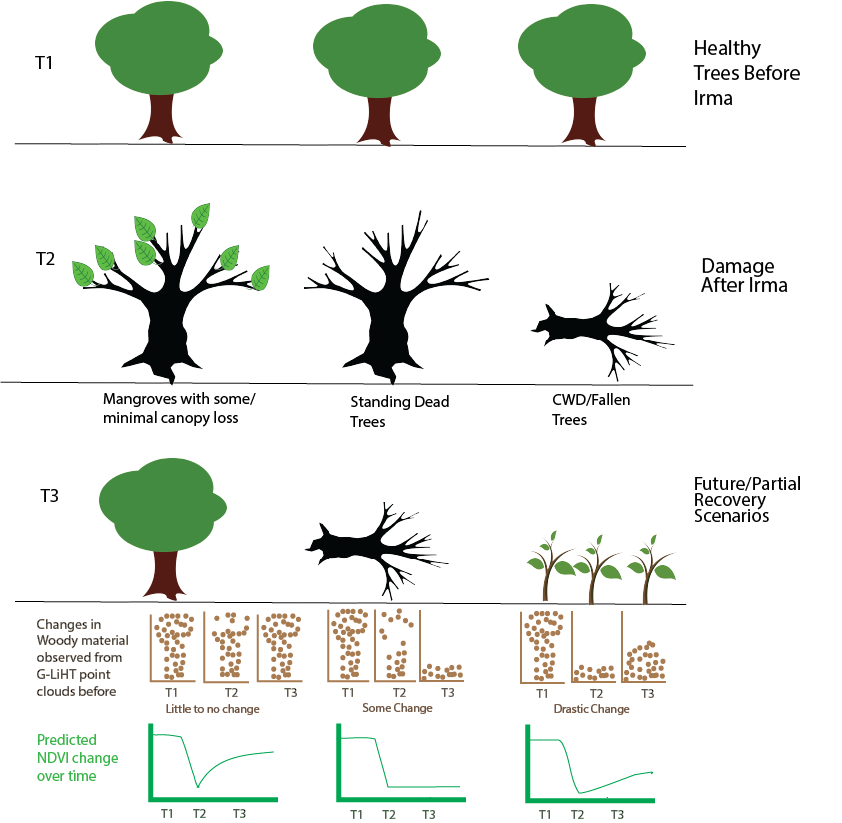
Schematic diagram presenting three hurricane growth conditions for three hurricane impact and recovery scenarios. The mangrove growth conditions are illustrated for pre-hurricane forests, immediately after the hurricane impact, and future (years) recovery projections. The diagram also provides estimated G-LiHT point-clouds and NDVI value changes during the three time points.
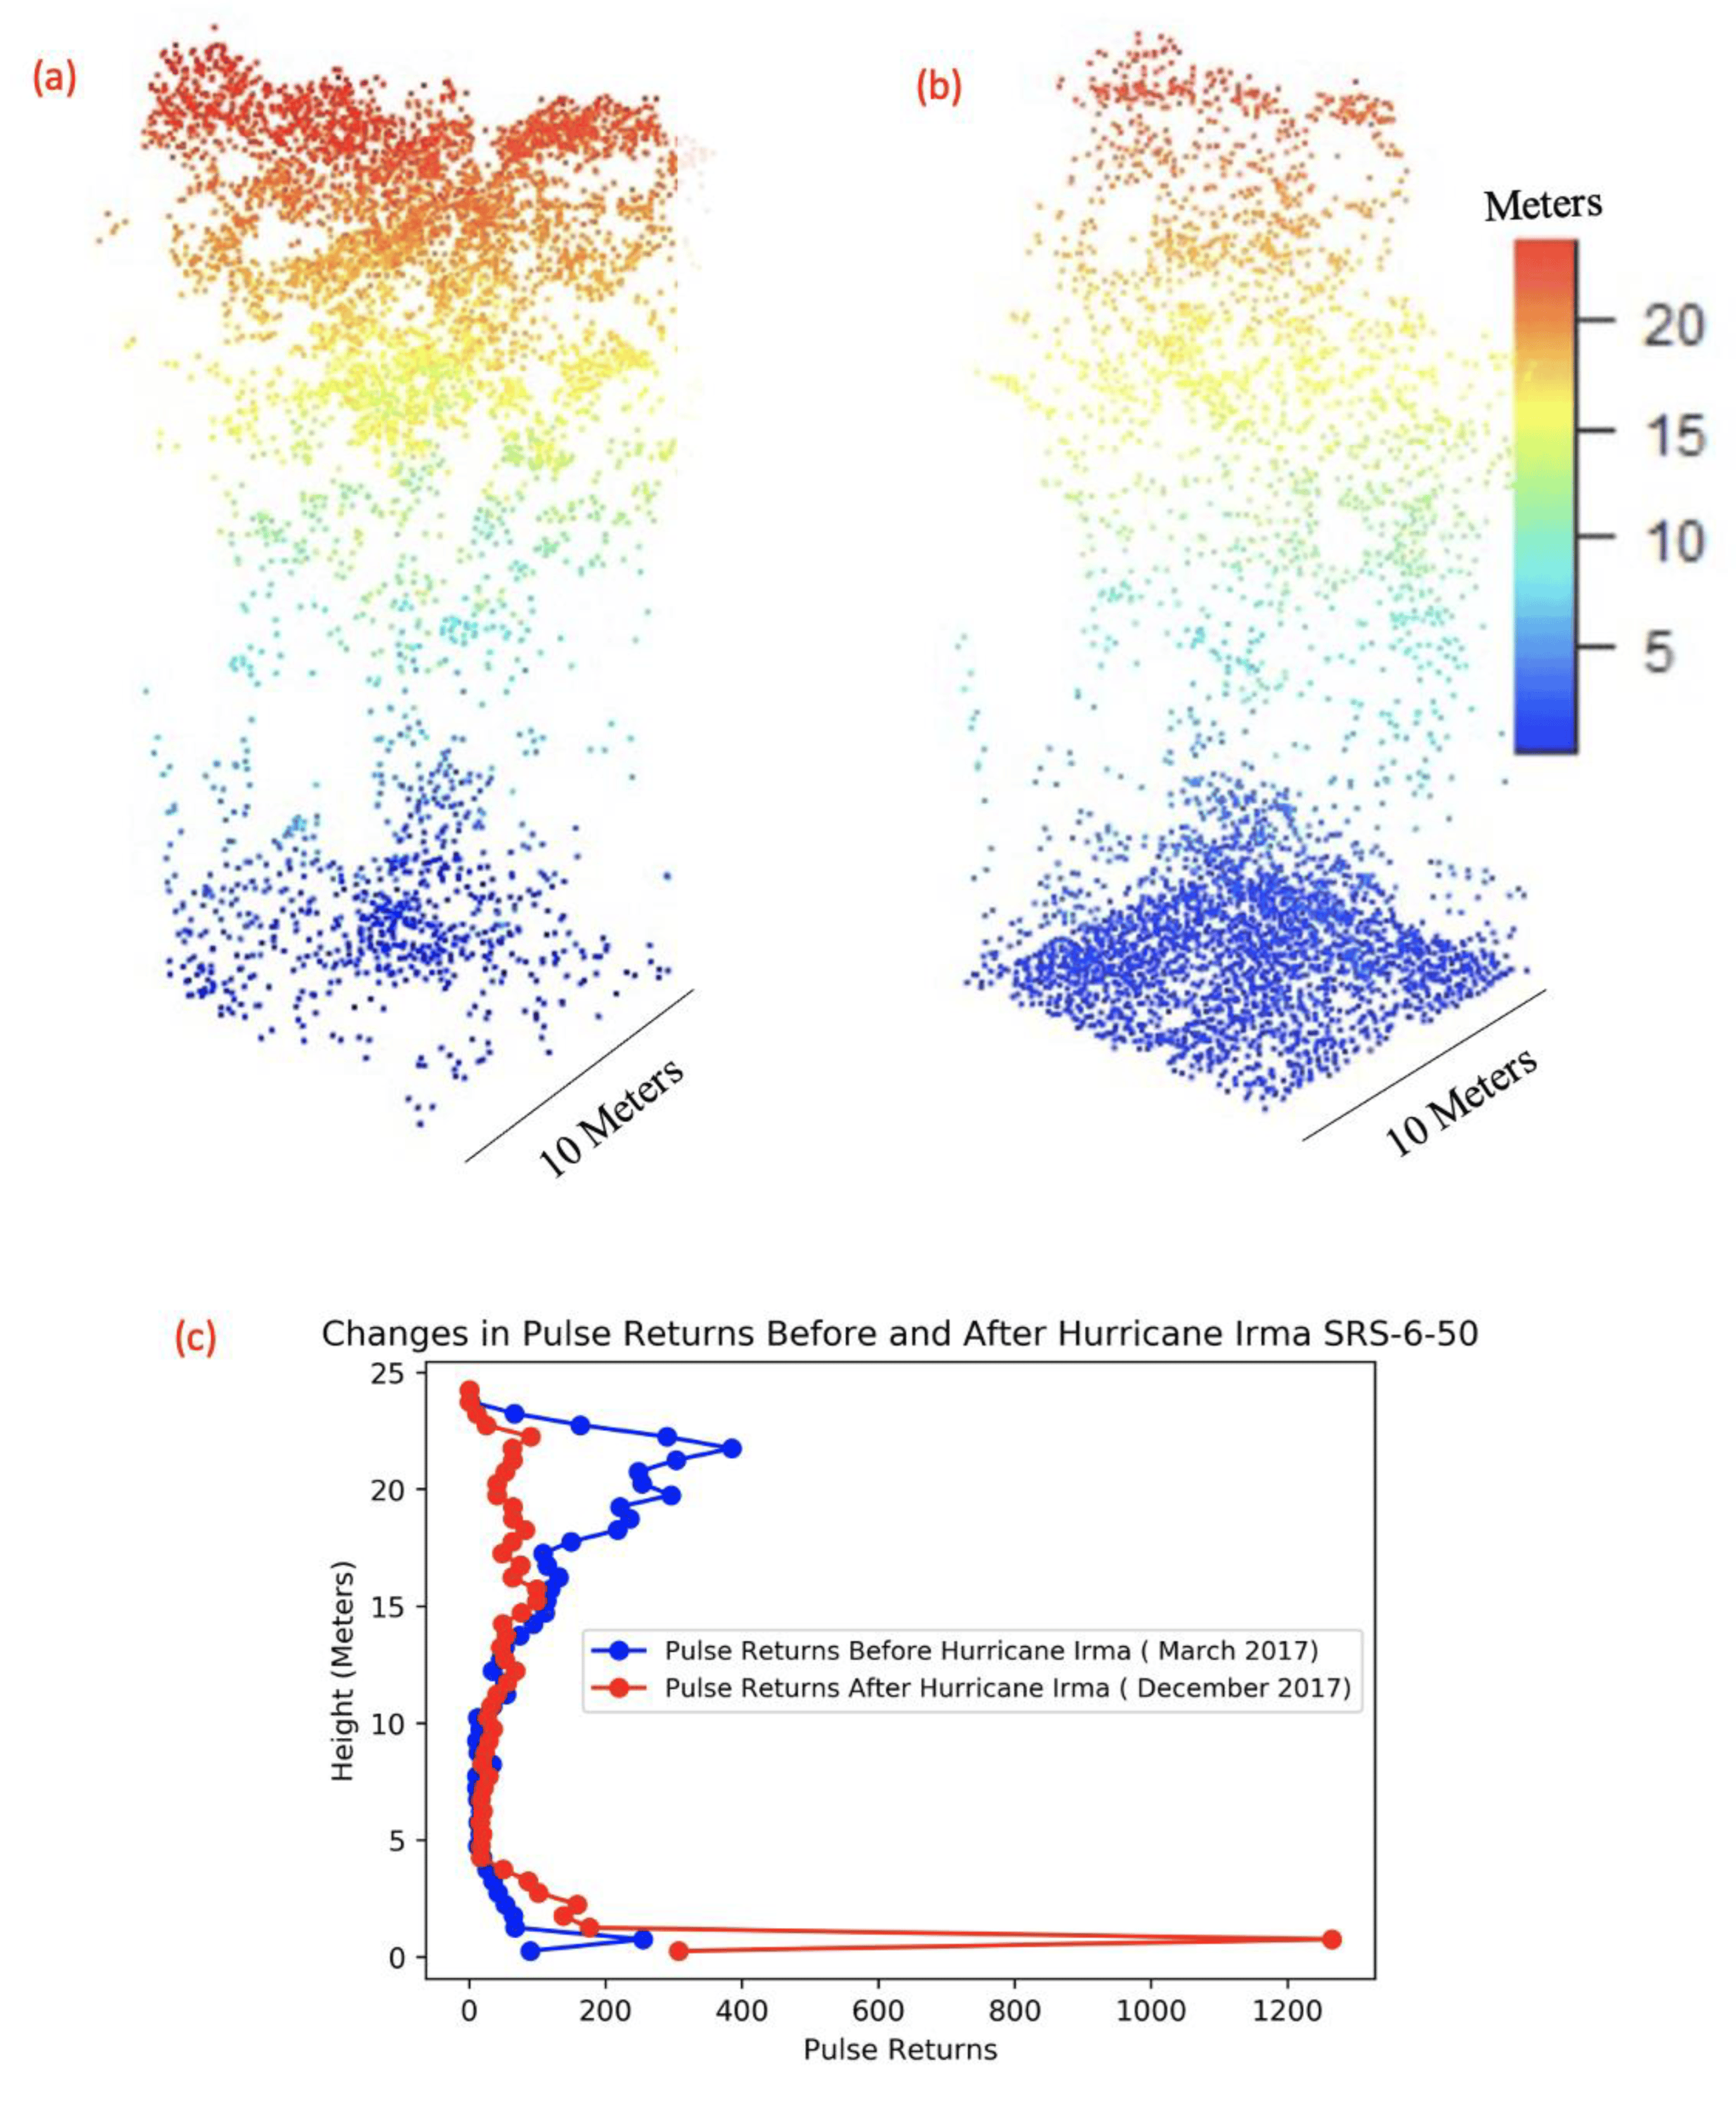
Processed point clouds showing 3D mangrove structure before Irma (a) in which you see a higher point density in upper height of canopy and after Irma (B) where we see point cloud is less dense in upper canopy.
Results
We calculated 3D point clouds from the March and December 2017 datasets for 13 field 10 × 10 m plots. In addition, we extracted higher-level G-LiHT products of F-Cover, Tree Mean, Shrub Mean, and Pulse Density from the March and December 2017 datasets, which are provided at 13 m resolution but were filtered using a 3 × 3 averaging spatial window to get a 39 × 39 m average for each metric. To visualize the differences in the 3D point cloud from before (March) and after (December) Hurricane Irma passage, we conducted a comparative point cloud analysis for each of the 13 field plots located in the Shark River and Harney River study region. The comparative analysis indicates significant changes in vertical point cloud density distribution, as can be seen at an individual tree scale Before Hurricane Irma, the point cloud had a high number of counts (very high density) in the upper canopy level, whereas after the hurricane the number of counts in the upper level (i.e., top canopy) was significantly reduced. The comparative analysis also shows a significant count increase near the ground and lower region of the point cloud. For most of the field plots, we also observed a decrease in the total amount of points calculated from the point cloud data after the storm, indicating a change in canopy structure.In addition, a noticeable decrease in the tree height after Hurricane Irma can be detected based on changes in the point cloud from before and after Hurricane Irma comparison.
|
Point cloud variations of a single mangrove tree in plot SRS-6-50 in the Shark River before (a) and after (b) passage of Hurricane Irma. Distribution of pulse returns from point cloud data (c) at different height intervals from before Hurricane Irma versus after Hurricane Irma has been plotted. It can be noted that a high concentration of point returns is shown in higher elevation (canopy level) before Irma and at a lower elevation near soil surface after Irma.
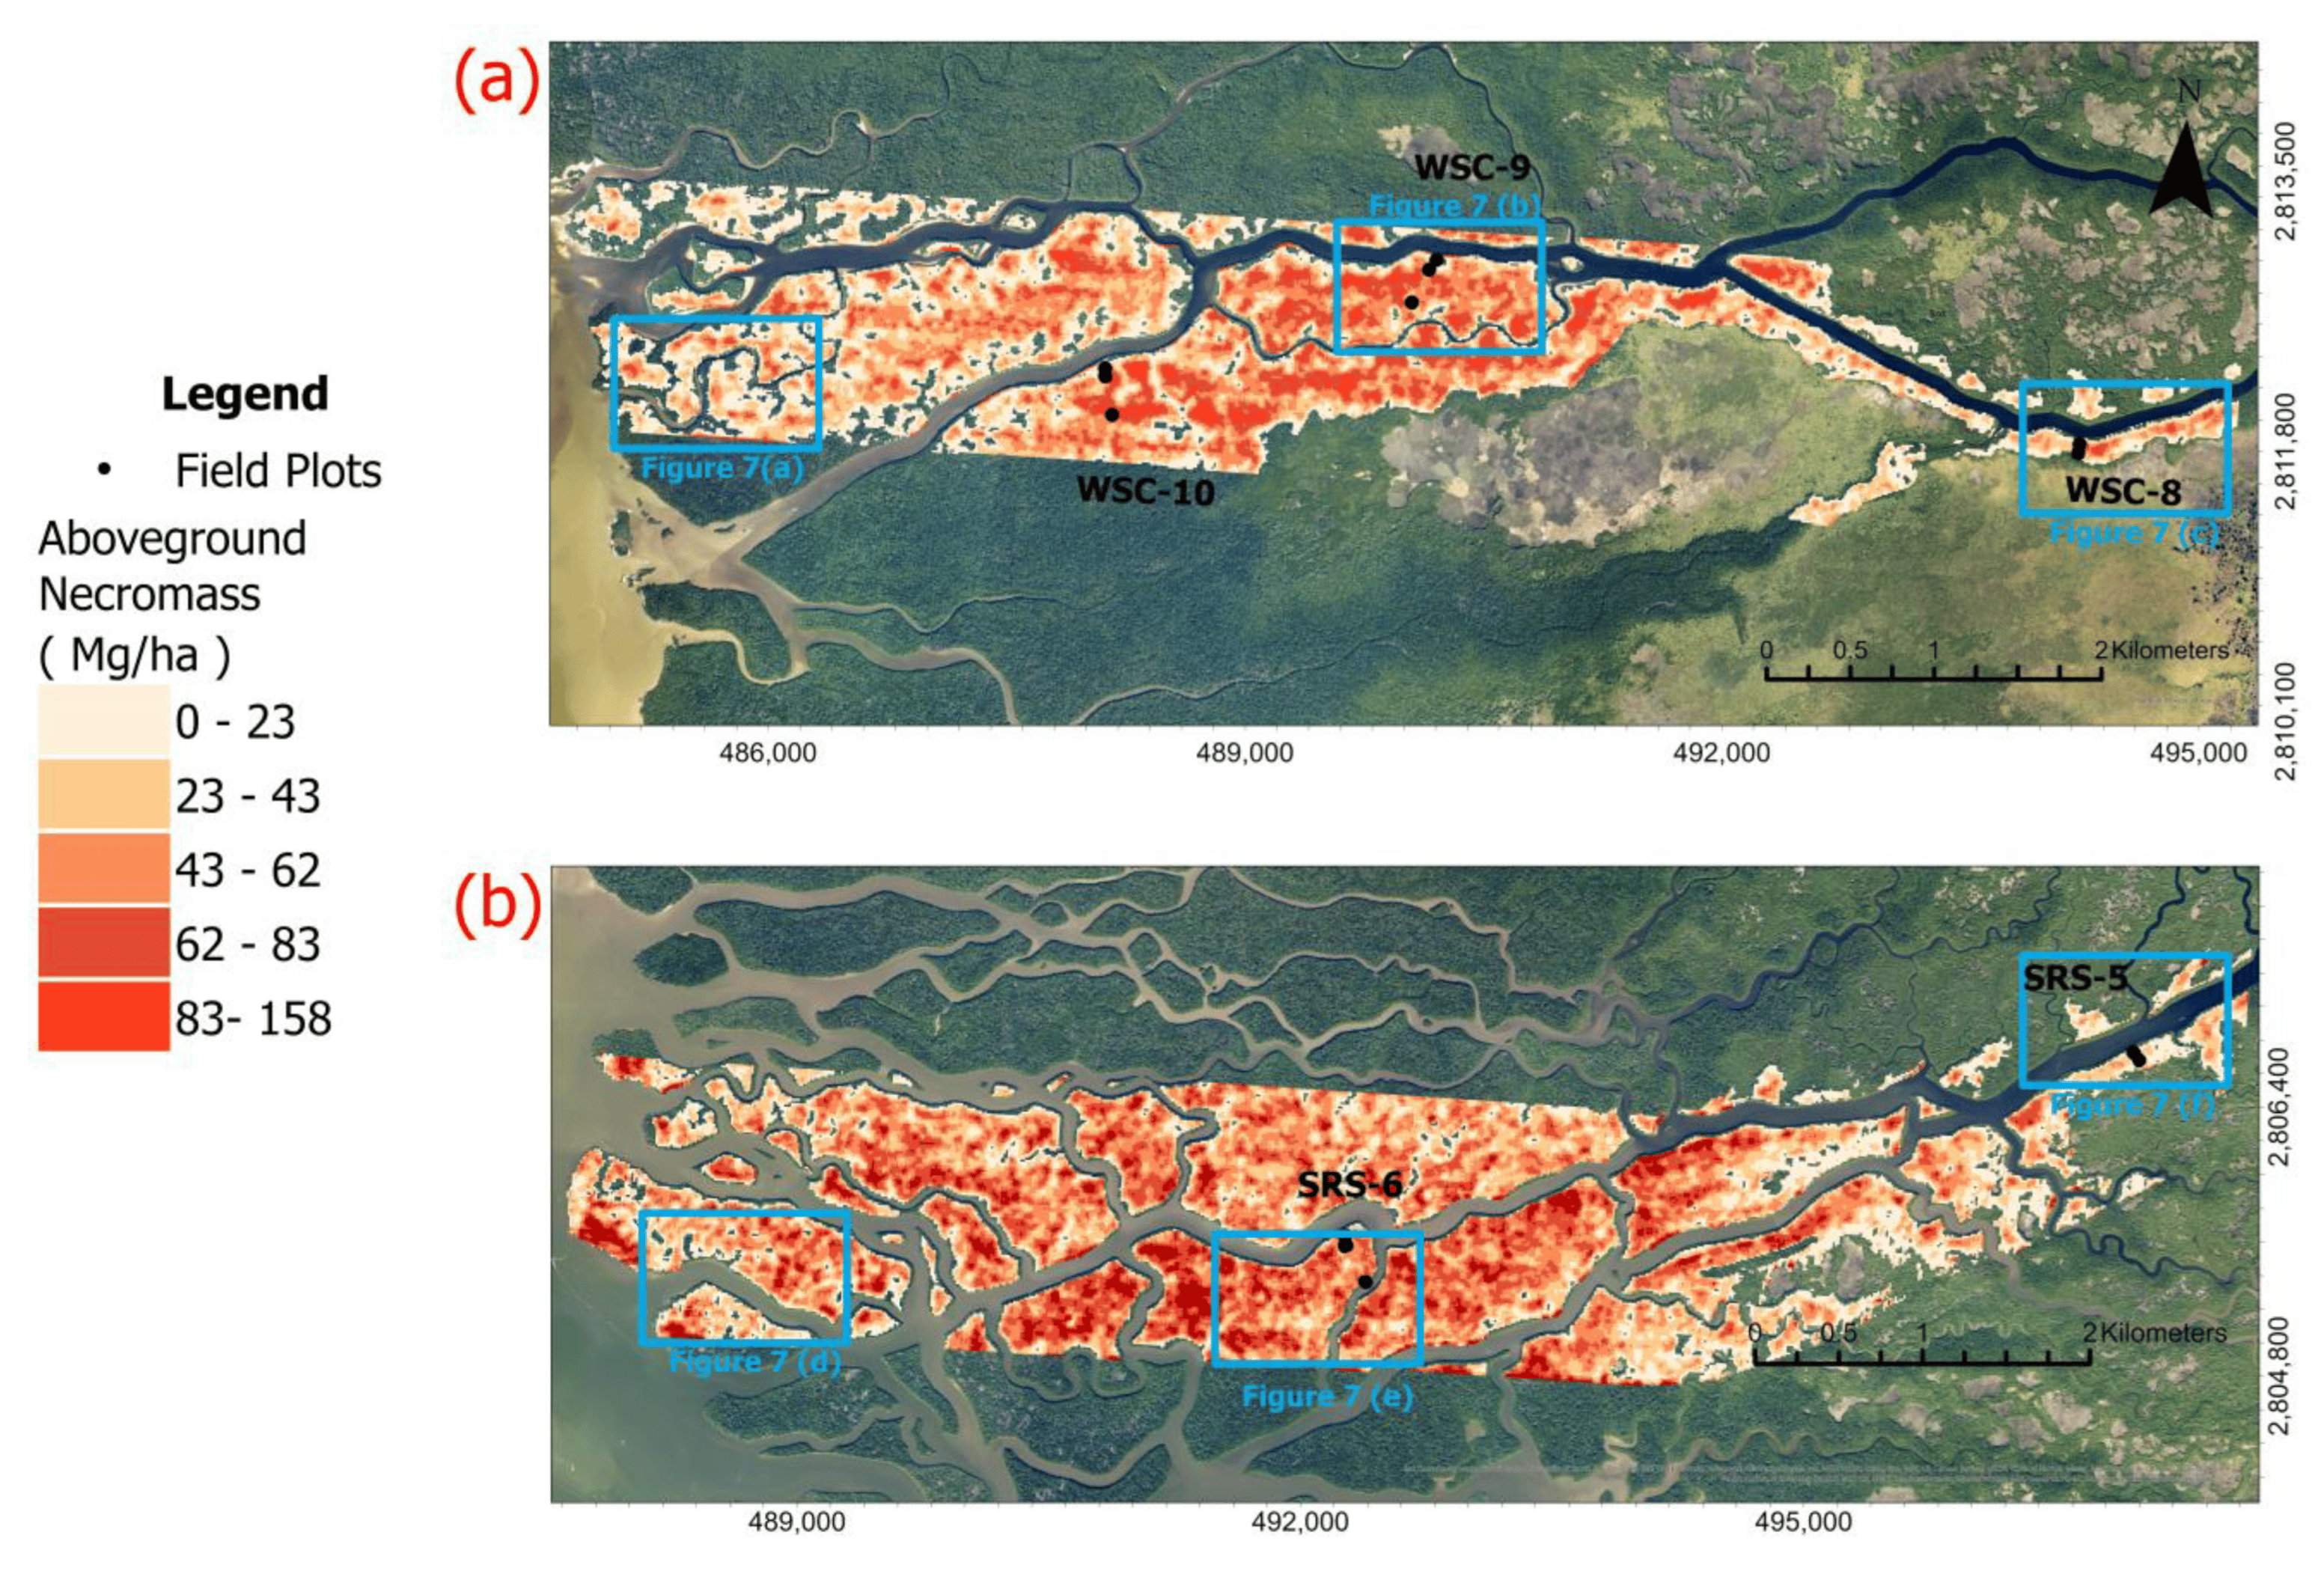
Using the a calculated regression we calculated AGN values for the entire G-LiHT surveyed area extending along the Shark and Harney Rivers . AGN values were applied only to mangrove forest areas, which occupy the entire western section of the swaths and appear within narrow areas along tidal channels in the eastern section of the swathes. Along both swaths, the calculated AGN varies in the range of 0–140 Mg/ha. However, the distribution of higher AGN values varies between the two swaths. Along the Shark River, high AGN values occurred all along the swath, with higher concentration of AGN south of the Shark River near the mouth of the estuary. High AGN values occurred mostly in the midstream section of the Harney River, roughly 3–6 km west of the Gulf coast. The calculated AGN maps also show that along both swaths, high values occurred in patches 200–300 m wide, some elongated in the E-W direction and some bounded by water bodies.
|
Upscaled distribution of modeled AGN estimates across the (a) Harney River and the (b) Shark River using the calculated linear regression equation.
Conclusions
By using high-resolution airborne lidar, we were able to successfully model and estimate hurricane-induced damages using AGN estimates for two river swaths of mangrove forests in the Everglades. Modeling AGN provided us an analysis on the distribution of damage Hurricane Irma caused on mangrove forests within our study region and suggests that spatial distance from the coast and forest edge, tree height, and surrounding landscape may play a role in the distribution of mangrove structural damage. Our results provide evidence that G-LiHT and airborne lidar are powerful tools in assessing large-scale hurricane disturbance and in improving our knowledge on how mangroves are affected by hurricanes on a canopy scale. However, our analysis also finds that G-LiHT alone is not sensitive enough to model finer-scale damage such as WD on the forest floor as we were unable to model WD using the proven G-LiHT data and metrics alone. Coupling G-LiHT with other remote sensing products may be beneficial for future research to attempt modeling volumes of WD in the future..
Link
Florida Coastal Everglades LTER - Florida International ...
G-LiHT
Full Published article available here
Contact
Selena Chavez
Graduate Student
Department of Earth and Environment
Florida International University
11200 SW 8th Street, PC 345, Miami FL 33199
PHONE: (305) 348-6826
E-Mail: schav063@fiu.edu