
Spatiotemporal variations of wetland backscatter: The role of water depth and vegetation characteristics in Sentinel-1 dual polarization SAR observations
Abstract
Synthetic Aperture Radar (SAR) backscatter observations are sensitive to hydrologic conditions and vegetation characteristics of land cover. This study conducted a high spatial-resolution investigation (30-m) on the response of dual-polarization C-band (5.6 cm wavelength) SAR backscatter coefficients (σ◦) to temporal changes of surface water depth (dw) and spatial variations of vegetation characteristics in the south Florida Everglades wetlands. We investigated (1) linear relationships between σ◦ and dw values, and (2) the effects of vegetation density and morphology on σ◦-dw relationships. We developed a new method to classify pixels with significant linear re- lationships of multi-temporal σ◦ and dw (R2 > 0.5 and p-value <0.04), which were termed “Reliable Scatterer” (RS). RS included positive, negative, and a combination of both positive and negative relationships (corre- sponding to RS+, RS− , RS±, respectively). Our analysis revealed spatially varying vegetation densities and morphologies had a significant impact on RS types, where we found RS+ type pixels for woody vegetation, RS± for a mix of medium- and high-density herbaceous vegetation using C-band VV (C-VV) data, and RS− for sparse herbaceous vegetation using C-VH data. Overall, our study indicates that C-band dual-polarization backscatter is sensitive to water-depth variations for some vegetation types, and this sensitivity has the potential to serve as a reliable indicator for monitoring water depth in wetland environments.
Background
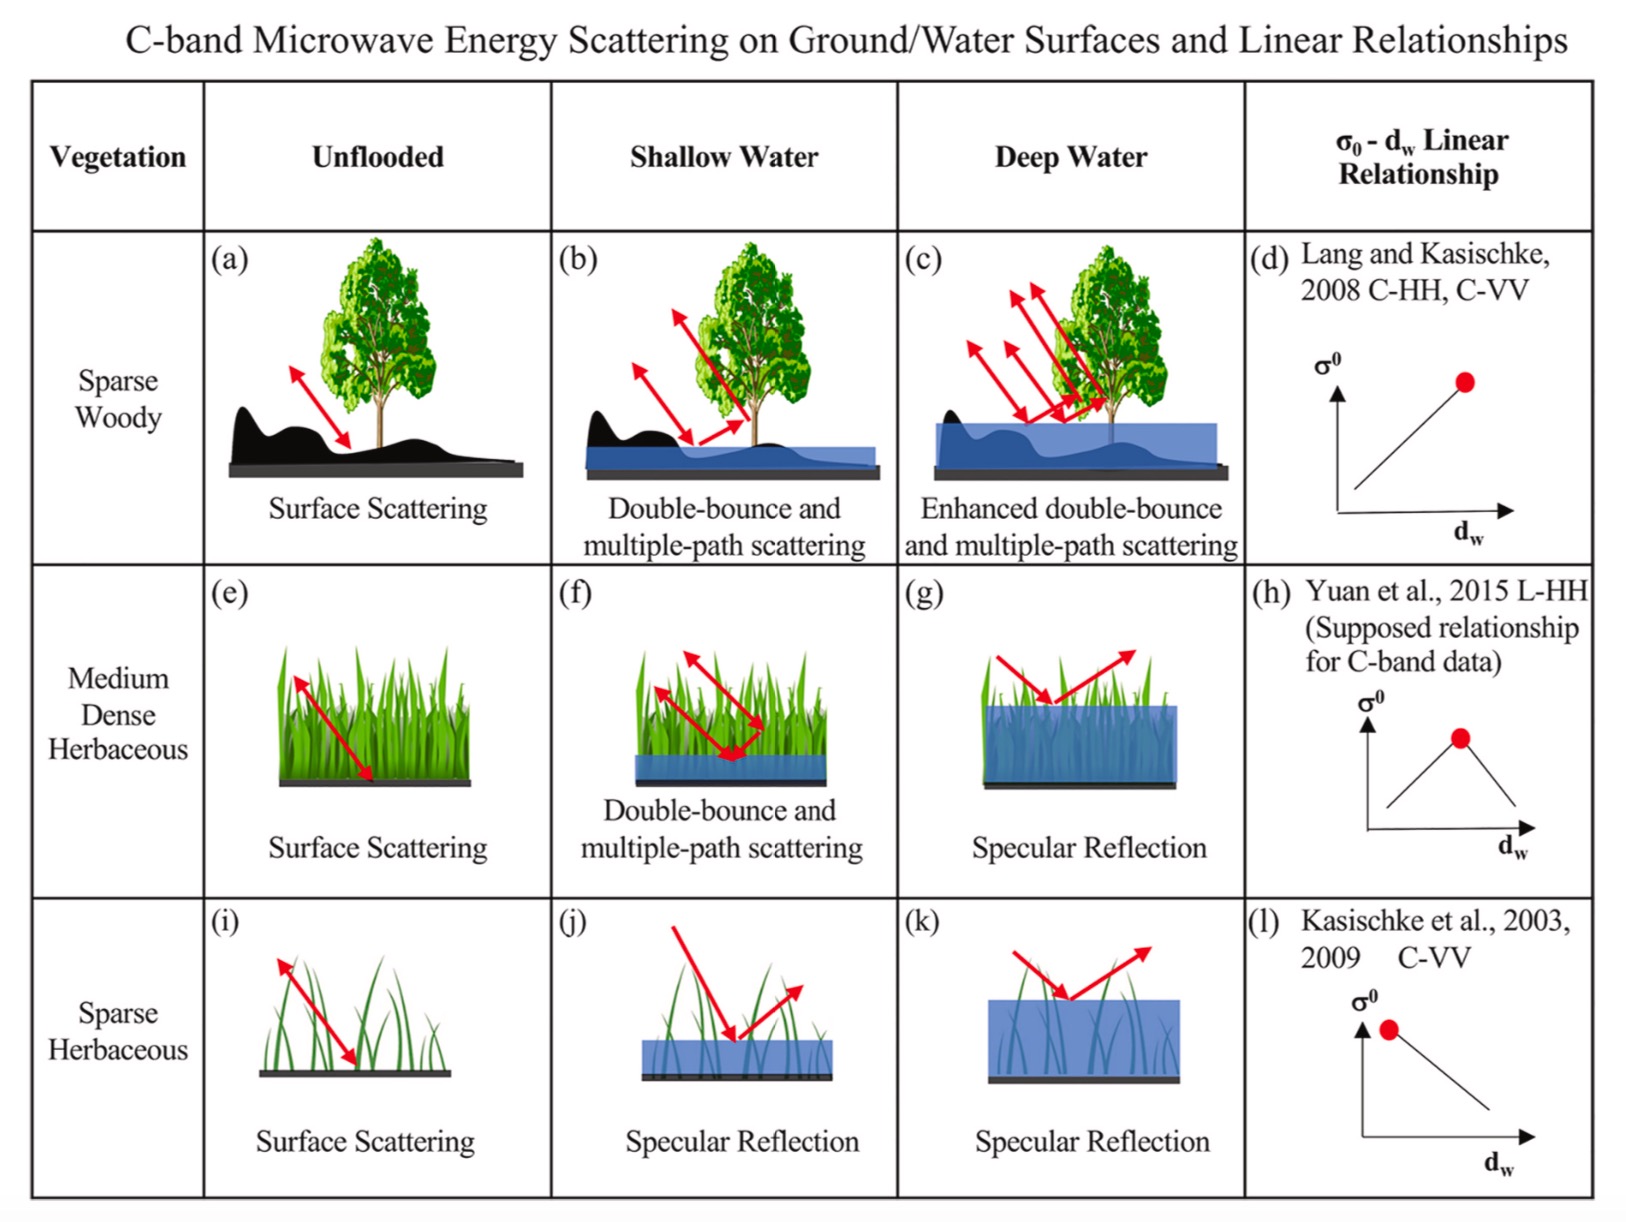
Figure 1. Summary of previous studies as schematic illustrations showing C-band microwave energy scattering from ground/water surfaces and linear relationships between co-polarized σ◦ (HH or VV) and dw for three vegetation types: sparse woody, medium dense, and sparse herbaceous. The second, third, and fourth columns show scattering at different water depths. Canopy and trunk scattering are not presented for simplicity. The last column shows the detected linear relationships between C-band σ◦ and dw based on previous studies and references with information on wavelengths and polarizations. Red dots denote the maximum backscatter value. Plots (a) - (c) and (e) - (g) are modified from Yuan et al. (2015) Fig. 12; (i) - (k) are modified from J.-W. Kim et al. (2014)Fig. 3(c). (For interpretation of the references to colour in this figure legend, the reader is referred to the web version of this article.)
Study Area
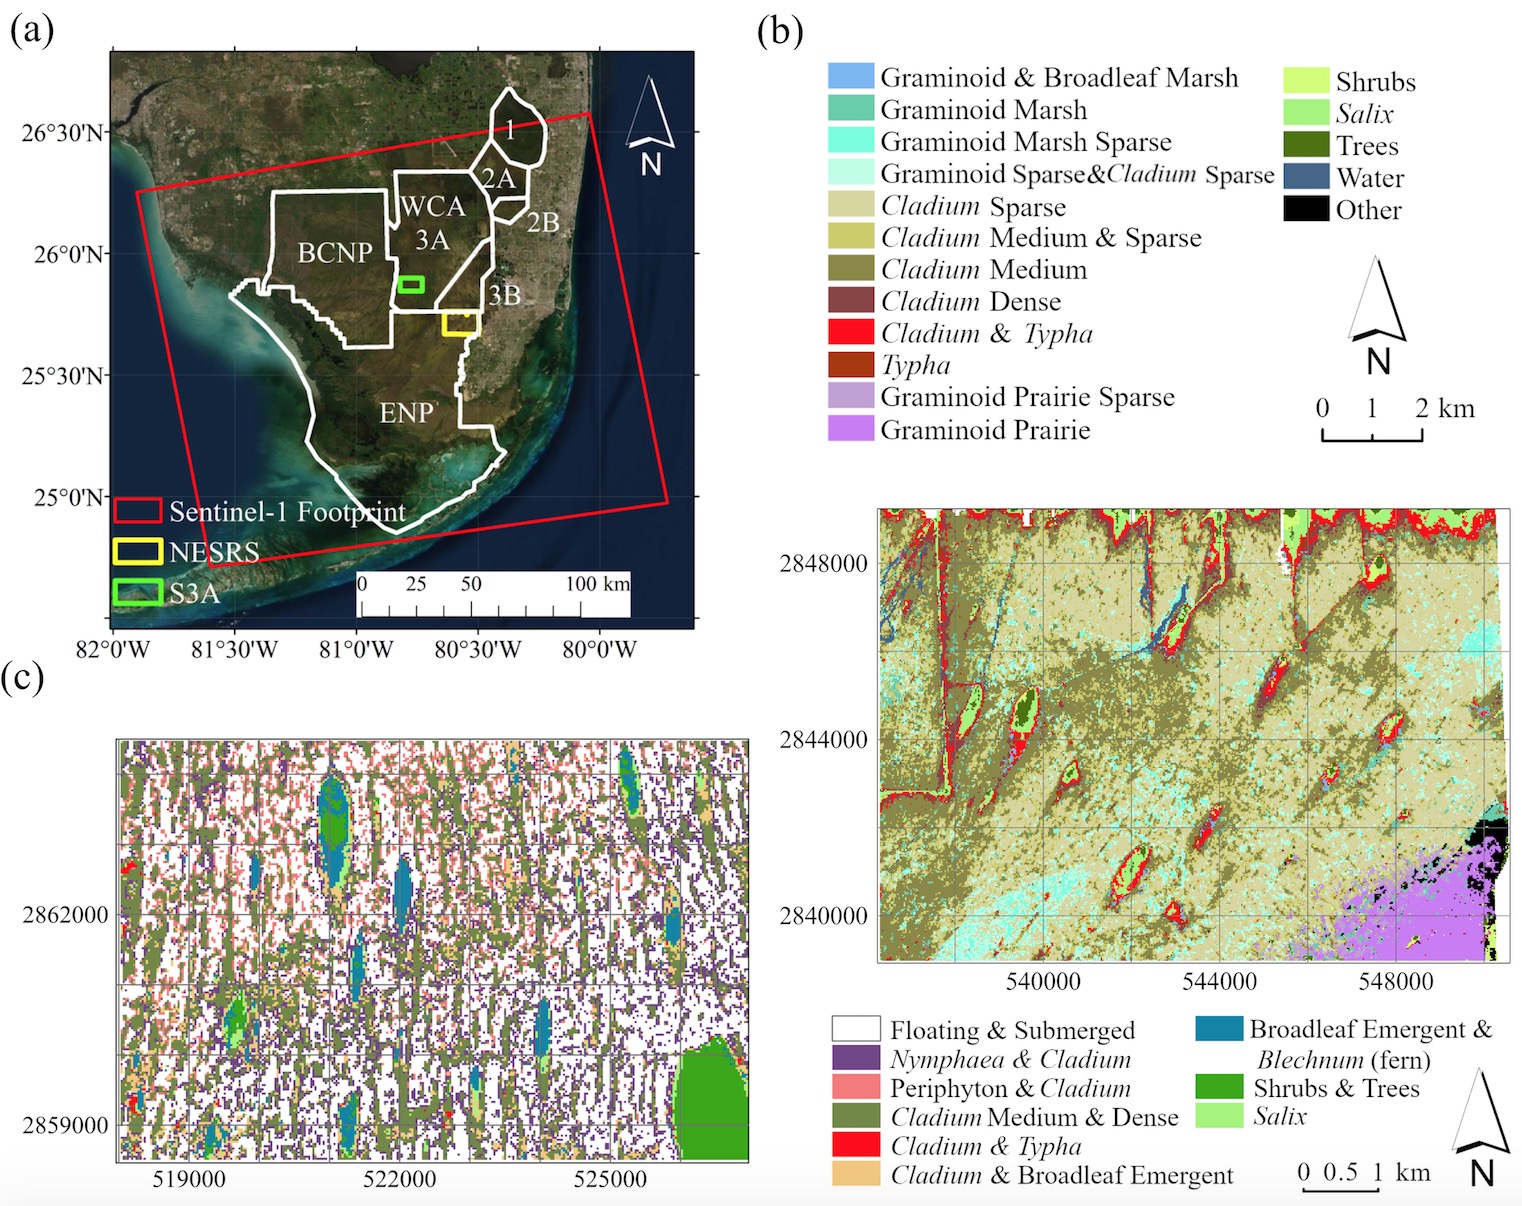
Figure 2. (a) Location map of the main hydrological units (polygons with white boundaries) in the Florida Everglades and two study areas (yellow and green rect- angles). The first study area, NESRS (yellow rectangle, 14,576 ha), is located in the northeast section of ENP. The second study area, S3A (green rectangle, 5,414 ha), is located in the southern portion of WCA-3A. The frame marked by the red line draws a footprint of the Sentinel-1A SAR scene used in this study. (b) and (c) show vegetation maps of the two study areas with a UTM coordinate system in a meter unit and a 30-m spatial resolution. Vegetation class information is provided in Table 1. The map background is a true-colour base map (Source: ESRI, DigitalGlobe, GeoEye, Earthstar Geographics, CNES/Airbus DS, USDA, USGS, AeroGRID, IGN, and the GIS User Community).
Data
To understand the relationships between backscatter, water depth, and vegetation characteristics across wetland plant communities in a spatiotemporal fashion, three categories of data products were used, (1) SAR backscatter observations acquired by the Sentinel-1 platform, (2) hydrological data in form of water surface maps and corresponding DTMs, (3) two types of vegetation data products generated from optical remote-sensing observations: vegetation maps derived from WorldView- 2 (WV2) data and the Normalized Difference Vegetation Index (NDVI) derived from Landsat 8 data.
Methodology
Our main analysis of the Sentinel-1 data was a two-stage procedure (Fig. 4). In the first stage (discussed in Section 5.1), we evaluated the direction (positive or negative) and the strength (measured by R2 and p- value) of linear relationships between σ◦ and dw values over the three- year period for each 30 m × 30 m pixel. Pixels showing a strong linear correlation (R2 larger than a threshold, R2th, and p-value less than a threshold, pth) were termed reliable scatterers (RS). Based on the described σ◦-dw relationships according to vegetation types in Section 2.2, we defined three RS types: positive (RS+), positive-negative (RS±), and negative (RS− ). A fourth, non-RS type, indicated that the linear relationships between σ◦ and dw were weak (R2 < R2th or p > pth). The method for classifying RS and non-RS types was provided in Section 5.1. In the second stage (discussed in Section 5.2), we investigated RS types in relation to vegetation types.
Details of the methodology can be found in the original paper Zhang et al. (2022)
Main Results
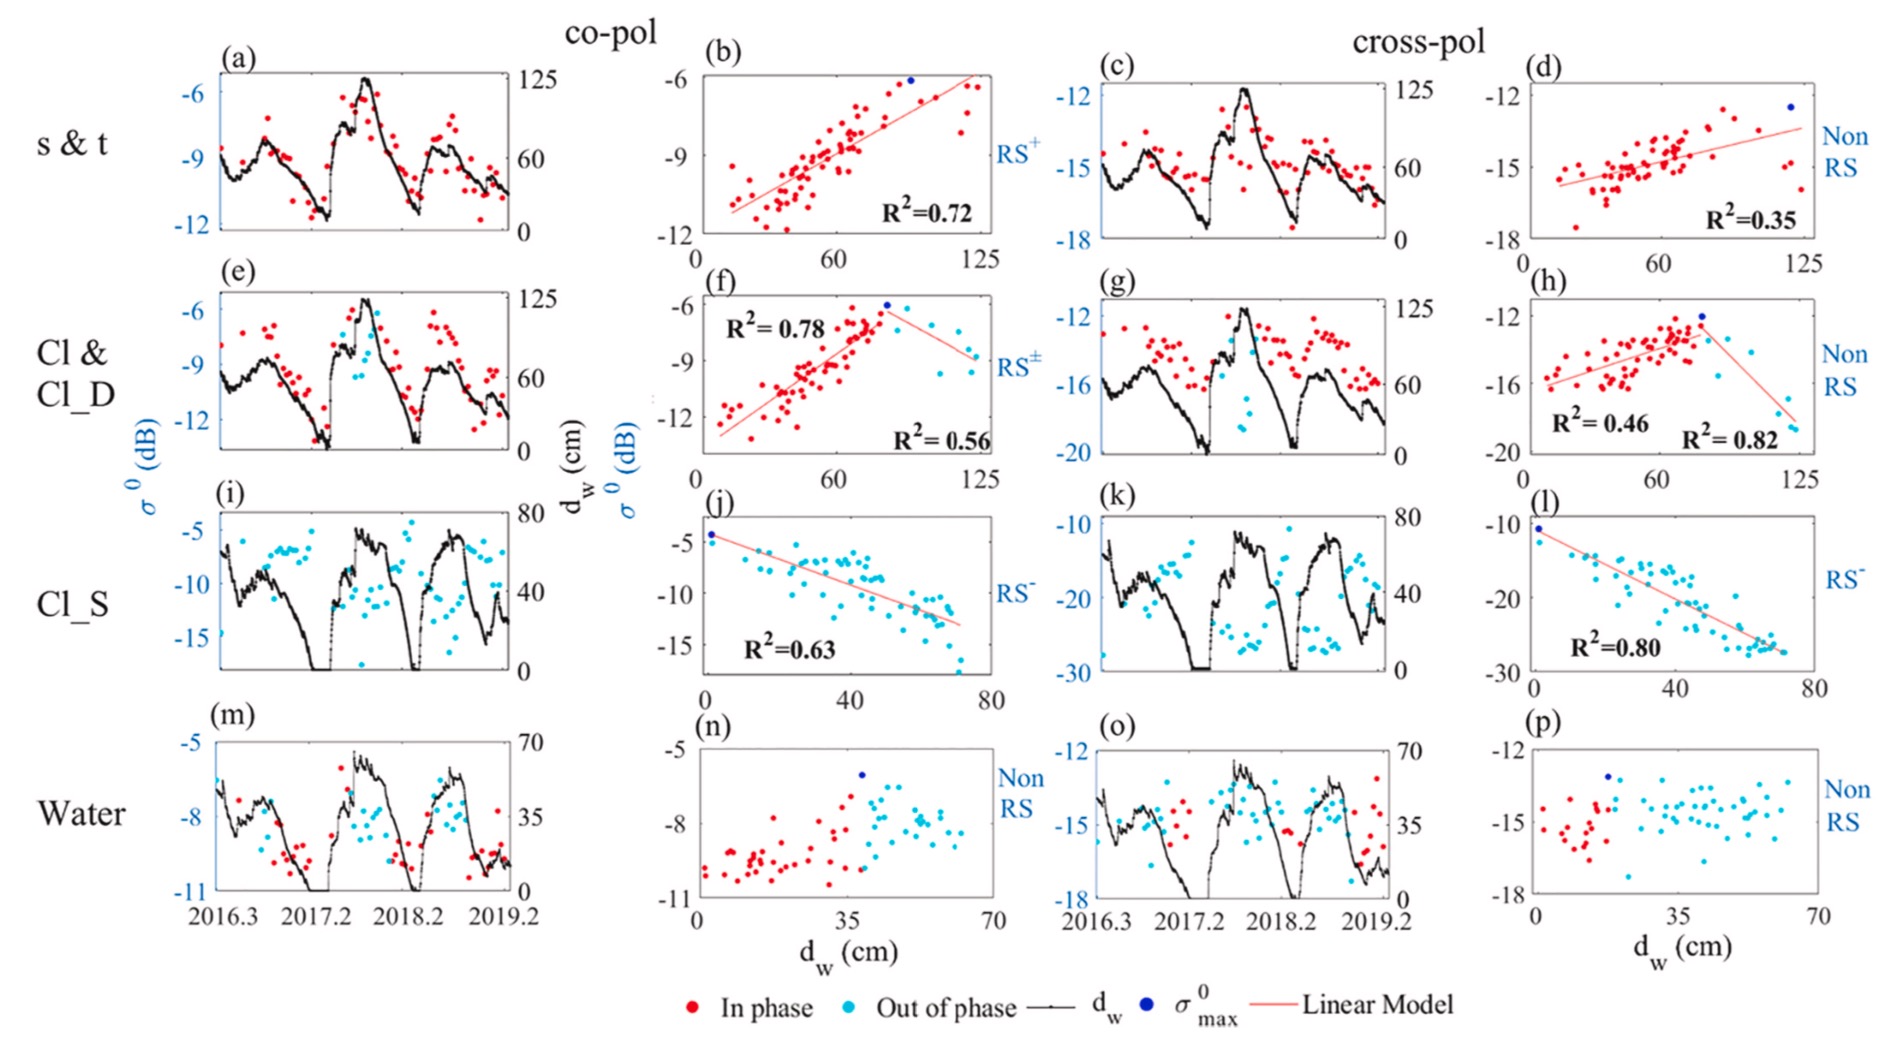
Figure 3. Four representative pixels (in row-major order) with distinct scattering behavior are presented according to C-VV (the first two columns) and C-VH (the last two columns) σ◦. Row one represents a pixel from the “Shrubs & Trees” (s & t) class in S3A; row two “Cladium Medium & Dense” (Cl & Cl_D) in S3A; row three “Cladium Sparse” (Cl_S) in NESRS; row four “Water” in NESRS. Column one (a, e, i, and m) displays time series of C-VV σ◦ (including red and cyan dots with values presented on the left y-axes) and daily median dw (black dash-dot line with values shown on the right y-axes) measured from April 2016 to March 2019 (time presented in decimal year format on the x-axes). Red dots indicate σ◦ in phase with dw; cyan dots indicate σ◦ out of phase with dw. All negative dw values are replaced with zero. Column two (b, f, j, n) shows scatter plots of σ◦ versus dw. Red and cyan dots are the same as (a, e, i, m); blue dots mark the σ◦max observations. The lines are the least-squares best-fit linear models. Column three (c, g, k, o) and four (d, h, l, p) show the time series of C-VH σ◦ and dw, and scatter plots of C-VH σ◦ and dw, respectively.
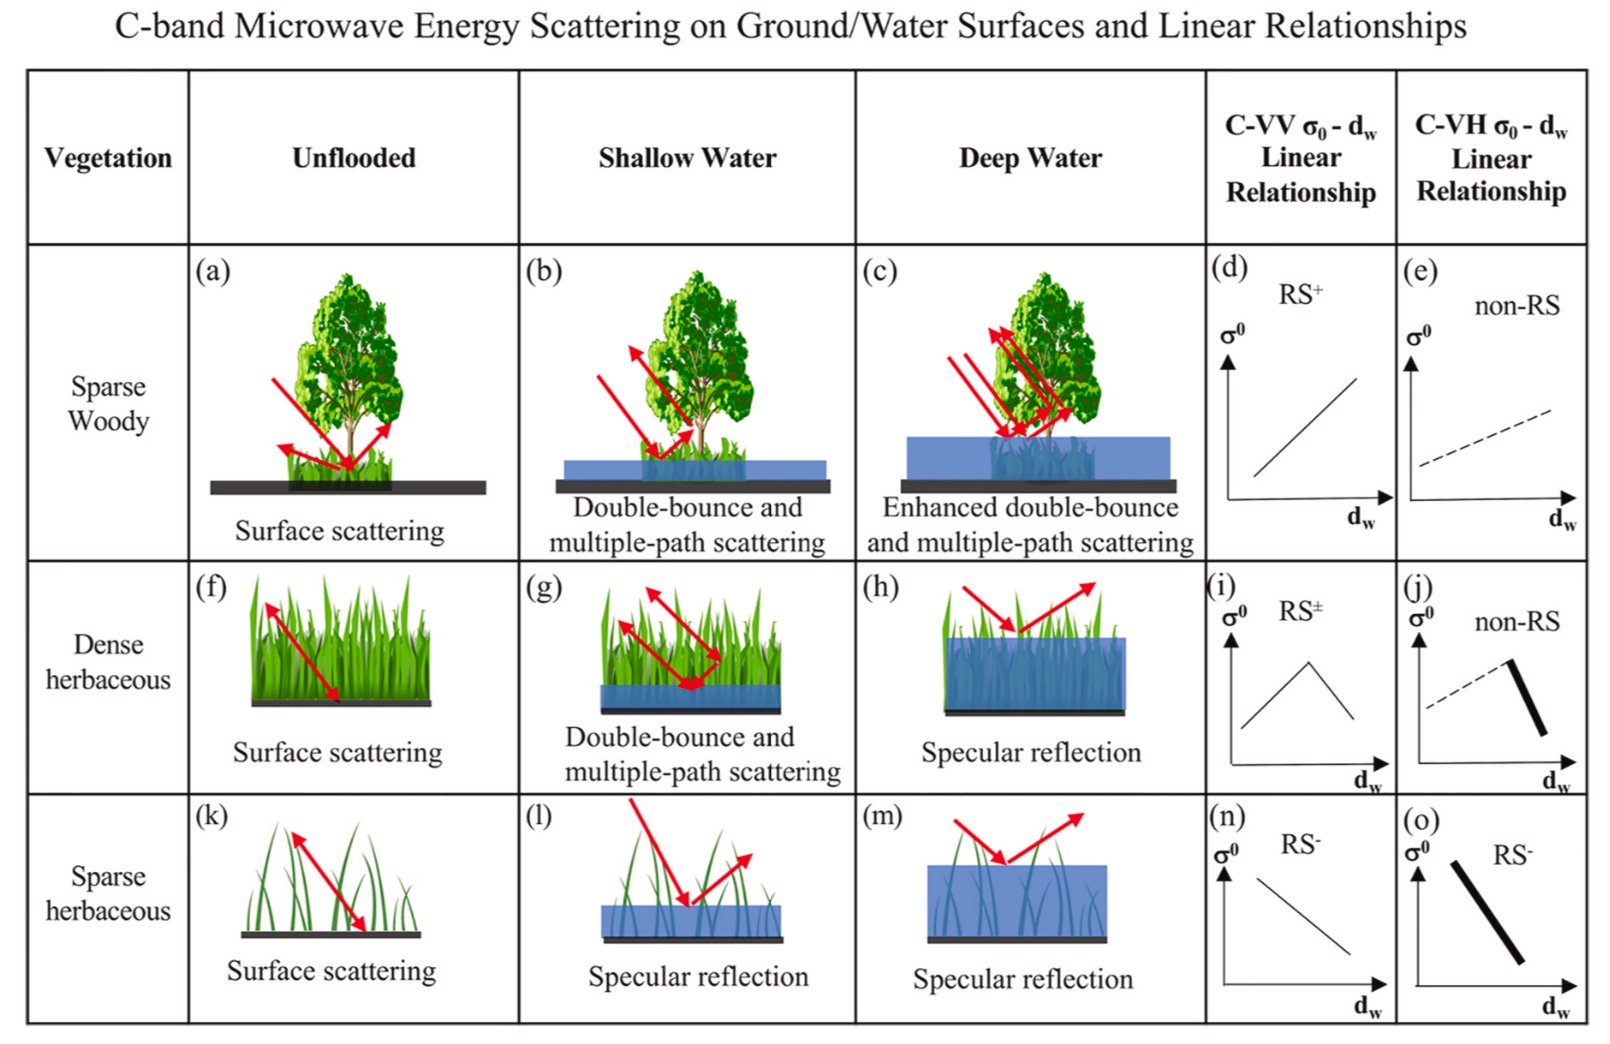
Figure 4. Schematic illustrations of the suggested C-band microwave energy scattering from the ground or water surfaces and linear σ◦-dw relationships for both C-VV and C-VH σ◦ for the same vegetation types with Figure 1. The text in each grid presents the dominant scattering mechanism(s). Dashed lines in (e) and (j) denote weaker linear relationships (less R2) and less sensitivity (shallower slope) to variations in water depths in C-VH observations than C-VV, and the bold lines in (j) and (o) denote stronger linear relationships and greater sensitivity to variations in water depths than C-VV.
Conclusion
Our study showed that C-VV and C-VH backscatter were sensitive to water depth changes in large areas of the Everglades wetlands. Pixels showing consistent linear relationships were termed reliable scatterers (RS) and classified based on the σ◦-dw linear relationships as RS+ (pos- itive), RS± (positive-negative), RS− (negative), and non-RS (weak re- lationships) types. To our knowledge, it is the first study that found a strong correlation between C-VH σ◦ and dw.
The observed σ◦-dw linear relationships were interpreted with changes in scattering mechanism in response to water depth changes representing microwave energy-water-vegetation interactions. Such in- teractions significantly varied with vegetation type, demonstrated by woody vegetation, mixed medium and dense Cladium, and sparse Cla- dium vegetation examples. C-VV and C-VH backscatter were similar in linear relationship types but different in sensitivity and strength of correlation to variations in water depths according to vegetation types.
Vegetation density and morphology had a significant impact on RS types. Both C-VV and C-VH backscatter were the most sensitive to water depth changes for sparse herbaceous vegetation, and this sensitivity decreased as vegetation density increased. For sparse to medium dense Cladium, RS− was the dominant RS type for C-VH σ◦ . However, for mixed medium and dense Cladium, RS± was the dominant RS type for C-VV σ◦. Ridge and slough landscape vegetation can serve as three RS types (RS+, RS±, RS− ) for C-VV or C-VH σ◦.
Attribution
The text and figures are provided by a publication of the journal Remote Sensing of Environment. Title is Spatiotemporal variations of wetland backscatter: The role of water depth and vegetation characteristics in Sentinel-1 dual-polarization SAR observations. Authors are Boya Zhang, Shimon Wdowinski, Daniel Gann, Sang-Hoon Hong, and Jay Sah. https://doi.org/10.1016/j.rse.2021.112864