
Space-based detection of significant water depth increase induced by Hurricane Irma in the Everglades wetlands using Sentinel-1 SAR backscatter observations
Abstract
Extreme rainfall, induced by severe weather events, such as hurricanes, impacts wetlands because rapid water-depth increases can lead to flora and fauna mortality. This study developed an innovative algorithm to detect significant water-depth increases (SWDI, defined as water-depth increases above a threshold) in wetlands, using Sentinel-1 SAR backscatter. We used Hurricane Irma as an example that made landfall in the south Florida Everglades wetlands in September 2017 and produced tremendous rainfall. The algorithm detects SWDI for during- and post-event SAR acquisition dates, using pre-event water-depth as a baseline. The algorithm calculates Normalized Difference Backscatter Index (NDBI), using pre-, during-, and post-event backscatter, at a 20-m SAR resolution, as an indicator of the likelihood of SWDI, and detects SWDI using all NDBI values in a 400-m resolution pixel. The algorithm successfully detected large SWDI areas for the during-event date and progressive expansion of non-SWDI areas (water-depth differences less than the threshold) for five post-event dates in the following two months. The algorithm achieved good performance in both ‘herbaceous dominant’ and ‘trees embedded within herbaceous matrix’ land covers, with an overall accuracy of 81%. This study provides a solution for accurate mapping of SWDI and can be used in global wetlands, vulnerable to extreme rainfall.
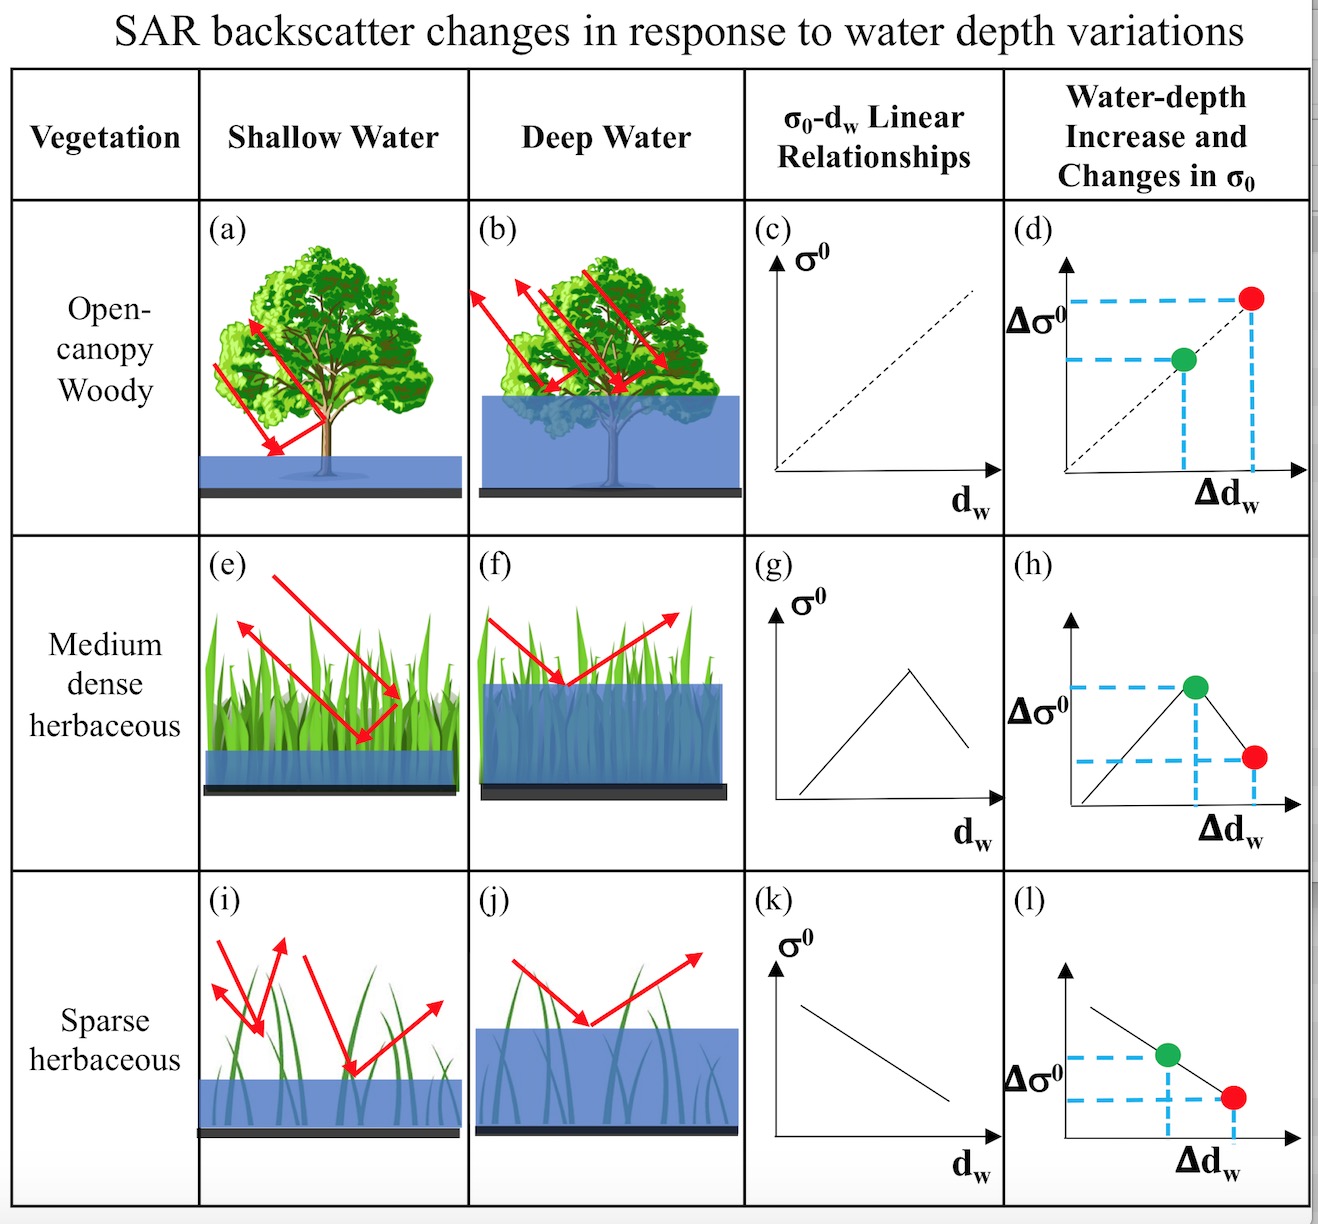
Figure 1. Schematic illustrations showing C-band backscatter (σ°) changes in response to wa-ter-depth (dw) variations for three vegetation types. The second (a,e,i) and third (b,f,j) columns present microwave energy-water-vegetation interactions under the conditions of shallow and deep-water depths, respectively. The fourth column (c,g,k) shows linear relationships between co-polarized σ° and dw according to (Zhang et al., 2022). The dashed line in (c) represents a weaker correlation than those in (g,k). The last column (d,h,l) shows water-depth increases (𝚫dw) resulting in changes in backscatter (𝚫σ°). The green and red dots in (d,h,l) represent pre- and post- rainfall event ob-servations, respectively, and cyan dashed lines show water-depth increases and changes in backscatter. This figure is a modified version of Figure 2 in (Zhang et al., 2022).
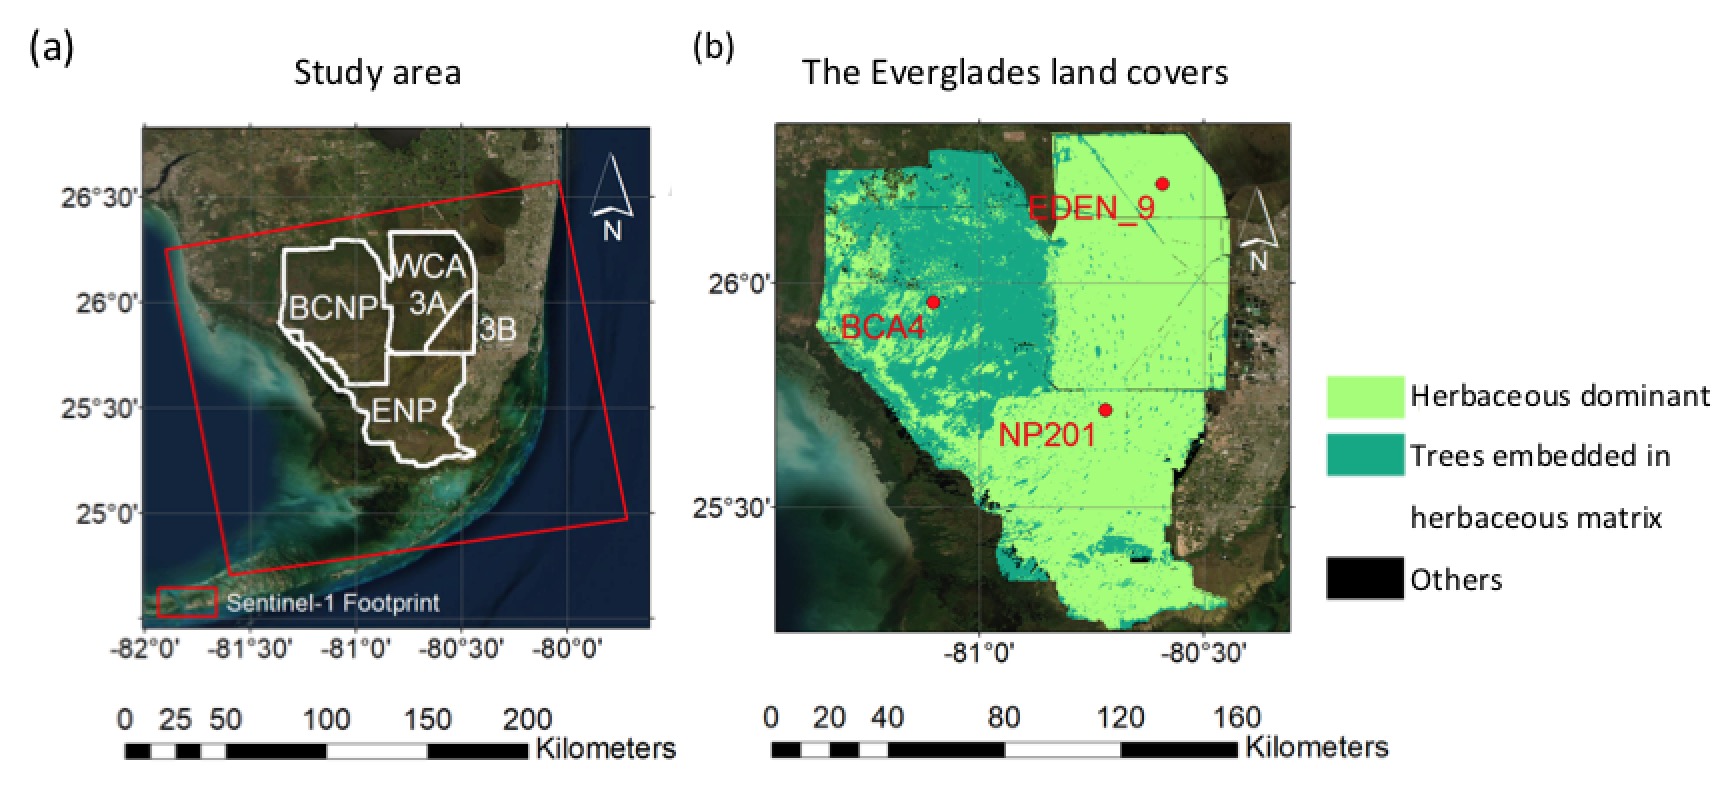
Figure 2. (a) Map of the study area in the Everglades according to the extent of EDEN water sur-face products, including four hydrological units (polygons with white boundaries). The red frame shows a Sentinel-1 SAR footprint. (b) The land cover map of the Everglades is derived from the South Florida Water Management District (SFWMD) Land Cover Use map for 2014–2016 (https://geo-sfwmd.hub.arcgis.com/datasets/sfwmd::sfwmd-land-cover-land-use-2014-2016/about, last accessed on November 1, 2021, with details provided in Supplementary Material Note 1). Red dots mark the locations of three selected EDEN water gauges presented in Section 5.1. (Background of both maps is the optical base map provided by ESRI, DigitalGlobe, GeoEye, Earthstar Geographics, CNES/Airbus DS, USDA, USGS, AeroGRID, IGN, and the GIS User Community).
Data
This study used Sentinel-1A SAR backscatter as the main dataset to detect significant water-depth increases (SWDI) induced by 2017 Category 4 Hurricane Irma in the south Florida Everglades wetlands. Sentinel-1A data were consistently acquired for the Everglades, with 51 scenes, from September 2016 to September 2018 (one year before and one year after Hurricane Irma), from the same ascending path 48 (European Space Agency- https://scihub.copernicus.eu/dhus/#/home, last accessed on 12th December 2021). SWDI detection used a total of nine acquisitions in the year 2017: three pre-event ones, acquired on 24 July, 17 and 29 August, one during-event, on 10 September, and five post-event ones, on 4, 16, 28 October, 9 and 21 November. The three pre-event SAR dates formed a baseline to capture the rapid water-depth increase induced by Hurricane Irma.
Methodology
The study uses a three-stage methodology to map SWDI and Non-SWDI areas (depending on whether water depth increases are over 12 cm or not). The first stage is to calculate Normalized Difference Water Depth (NDBI). NDBI is calculated at the SAR pixel level (20 m resolution), by subtracted target backscatter by the average of pre-event backscatter, and then divided by the standard deviation of pre-Irma backscatter values.
The second stage count the proportion of SAR pixels within an EDEN pixel (400m resolution) satifying the criterion of NDBI < -3. If the proportion is larger than the threshold (nswdi) then the EDEN pixel is classified as SWDI. If the proportion is less than the threshold (nnon-swdi), the EDEN pixel is classified as Non-SWDI. If the proportion is between nnon-swdi and nswdi, the EDEN pixel is classified as Uncertain. The third stage is to validate the results based on EDEN water surface models. Details of the method please refer to the original paper.
Results
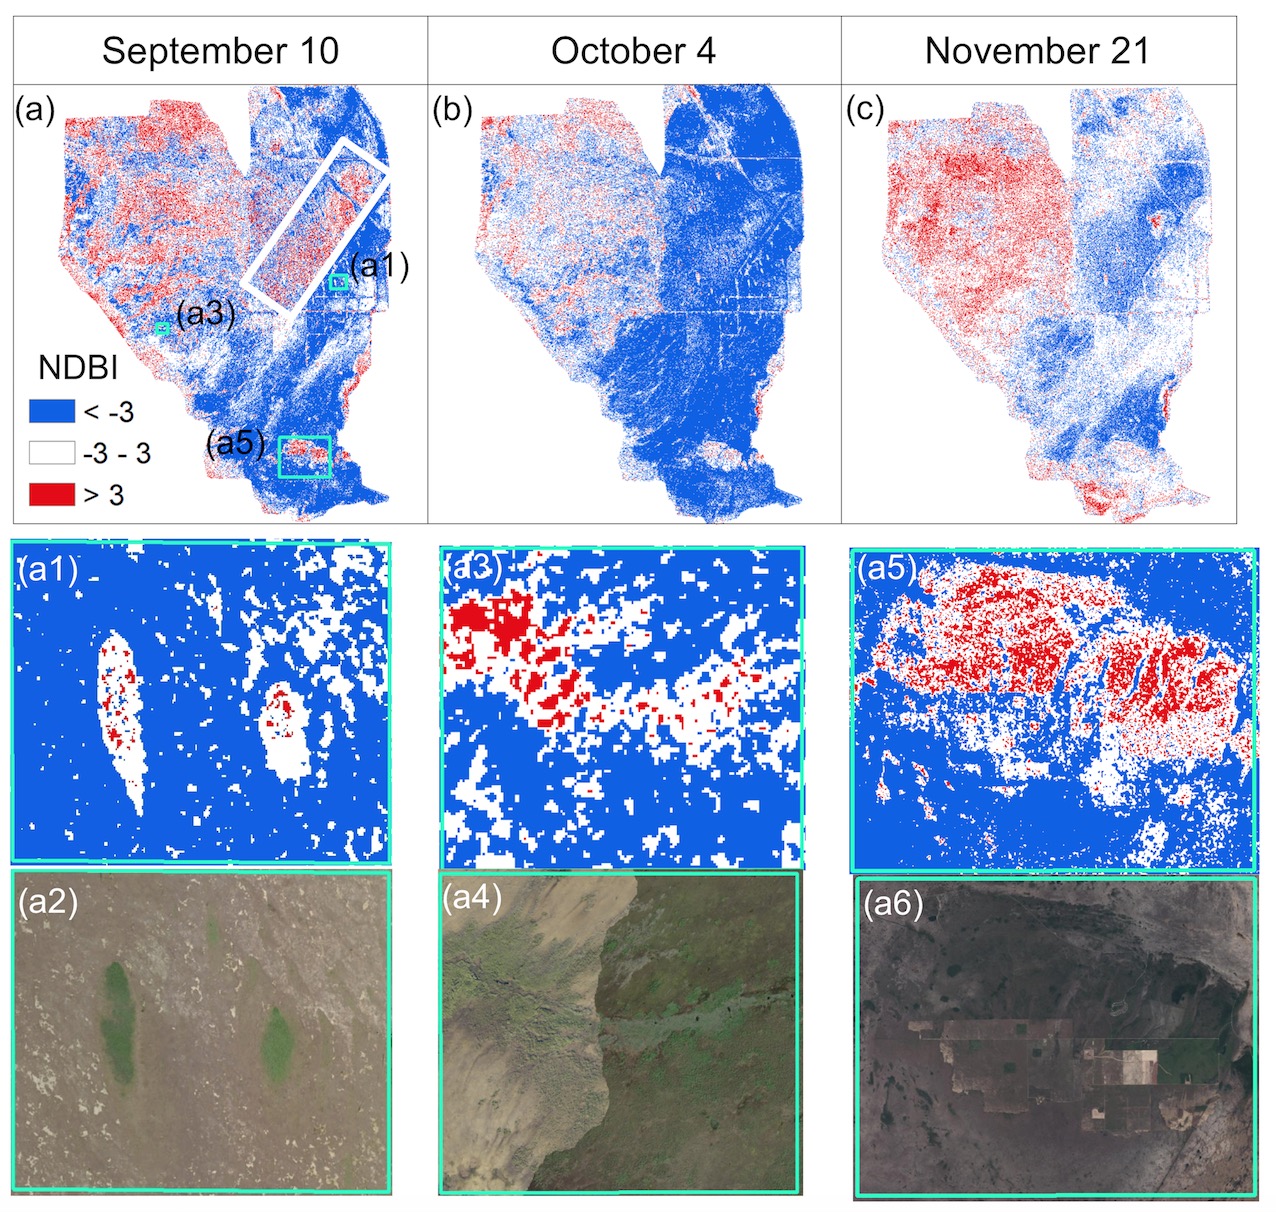
Figure 3. (a) NDBI map for the during-event (10 September) SAR acquisition with three cyan frames denoting local areas with a contrast NDBI pattern and a white frame denoting the boundary area between WCA-3A and 3B. (b,c) NDBI map for post-event SAR dates October 4 and November 21, respectively. (a1–a6) Zoomed-in views of three exemplary areas with (a1,a3,a5) displaying classified NDBI values and (a2,a4,a6) displaying the corresponding optical images. The figures are similar to the results reported in our previous study (Zhang et al., 2018).
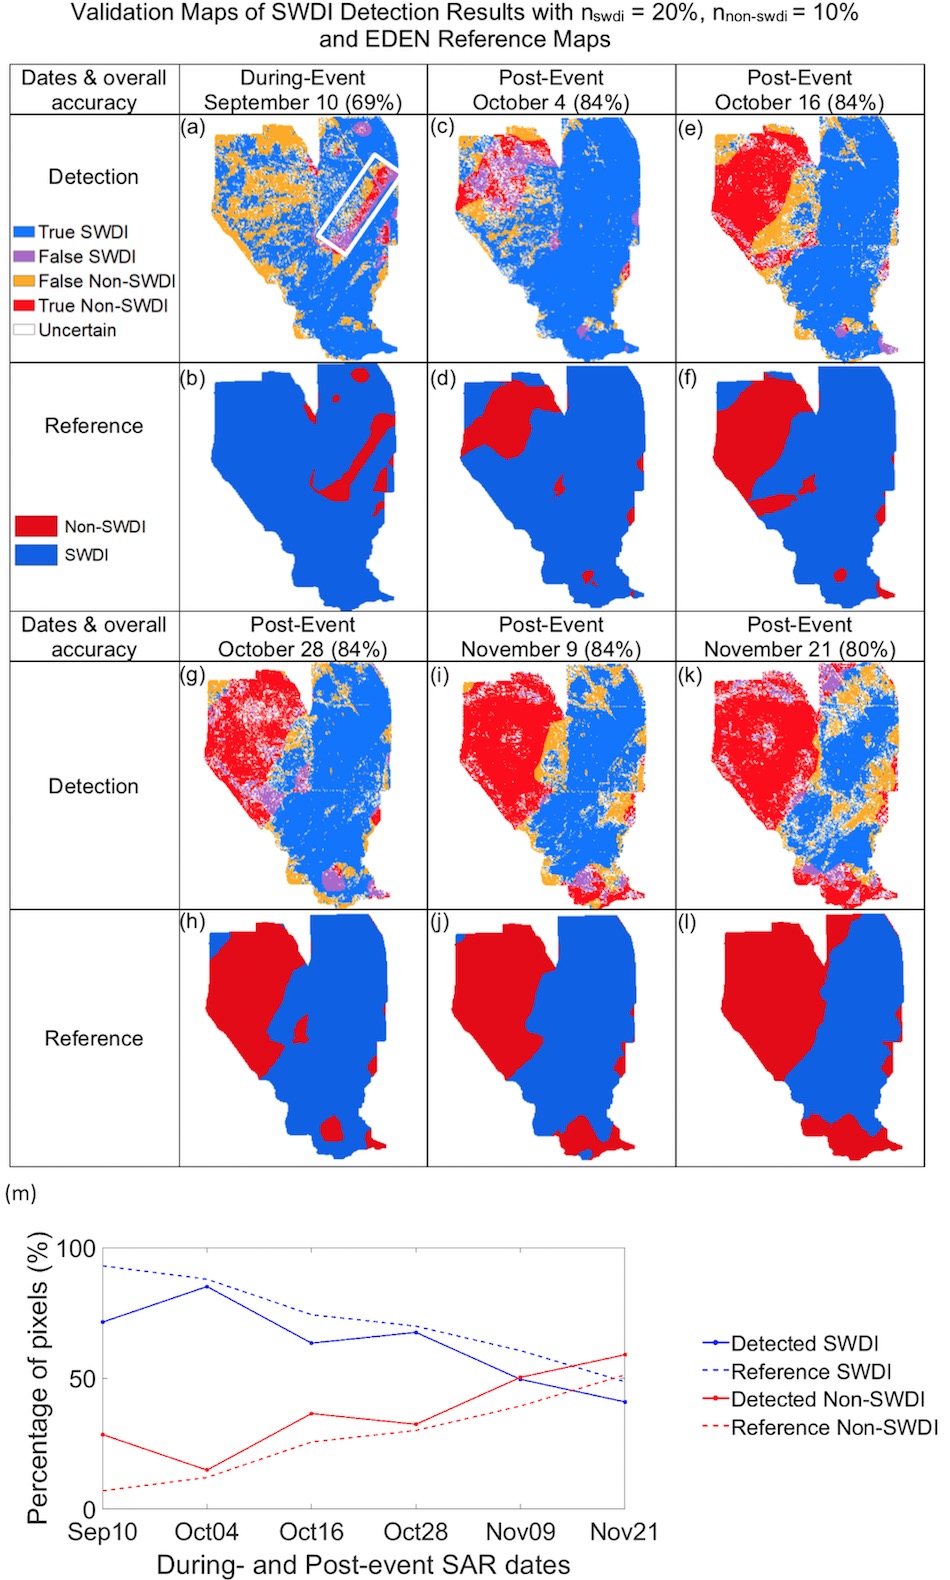
Figure 4. (a–l) Validation maps for SWDI detection and corresponding reference maps for the six target dates. The white polygon in (a) represents boundary areas between WCA-3A and 3B with a mix of true and false classifications. (m) Time series of pixel percentages of the classified and reference SWDI and non-SWDI classes.
Conclusion
This study developed a SAR backscatter-based algorithm to detect significant water-depth increase, or SWDI, in vegetated wetlands, using the Everglades as an example, which experienced rapid water level increase during the passage of Hurricane Irma in September 2017. The SWDI detection used multi-temporal backscatter from pre-, during-, and post-event SAR acquisitions. The algorithm, consisting of three stages, classifies each 400-m scale pixel to one of the three classes: ‘SWDI’, ‘Non-SWDI’, and ‘Uncertain’. The classified SWDI and non-SWDI areas showed a remarkable agreement with EDEN reference for all six target dates, accurately representing large SWDI areas during the event and progressive expansion of non-SWDI areas in the following two months. The algorithm performed well for both ‘herbaceous dominated’ and ‘trees embedded in herbaceous vegetation matrix’ land covers.
Reference
Zhang, B., Wdowinski, S., Gann, D., Hong, S.H. and Sah, J., 2022. Spatiotemporal variations of wetland backscatter: The role of water depth and vegetation characteristics in Sentinel-1 dual-polarization SAR observations. Remote Sensing of Environment, 270, p.112864.
Zhang, B., Wdowinski, S., Oliver-Cabrera, T., Koirala, R., Jo, M.J. and Osmanoglu, B., 2018. Mapping the extent and magnitude of sever flooding induced by Hurricane IRMA with multi-temporal SENTINEL-1 SAR and Insar observations.
Attribution
The text and figures are provided by a publication from journal Remote Sensing. Title is Space-Based Detection of Significant Water-Depth Increase Induced by Hurricane Irma in the Everglades Wetlands Using Sentinel-1 SAR Backscatter Observations. Authors are Boya Zhang, Shimon Wdowinski, Daniel Gann. https://www.mdpi.com/2072-4292/14/6/1415