
Cascading Hazards: Understanding triggering relations between wet tropical cyclones, landslides, and earthquakes
Research Highlights
1. Quantification of Erosional Unloading induced by Landslides induced by Typhoon
This work focuses on quantifying excess erosion induced by landslides induced by Typhoon Morakot (2009) in Taiwan. This is based on measurements of fluvial suspended sediment concentrations, which are measured in many Taiwanese rivers approximately twice per month, and river water discharge, which is measured daily. These rates can be compared to extensive landslide inventories based on aerial imagery obtained before and after Morakot, which shows that much of the landsliding coincident with Morakot took place in the southeastern end of the island. To assess the degree to which Typhoon Morakot affected erosional unloading, in each river we compared the post-Morakot sediment discharge to the sediment discharge that would have occurred if Morakot had not happened. That is, we applied pre-Morakot rating curves (based on all historical data before Morakot) to the post-Morakot fluvial water discharge record. The difference between the two can be used to estimate the excess erosion rates attributable in part to changes invoked by landsliding during Morakot. We show that these "excess" erosion rates correlate with upstream landslide volume based on a previously published database of Morakot-induced landslides, supporting the idea that erosional changes were associated with this landsliding event (Figure 1).
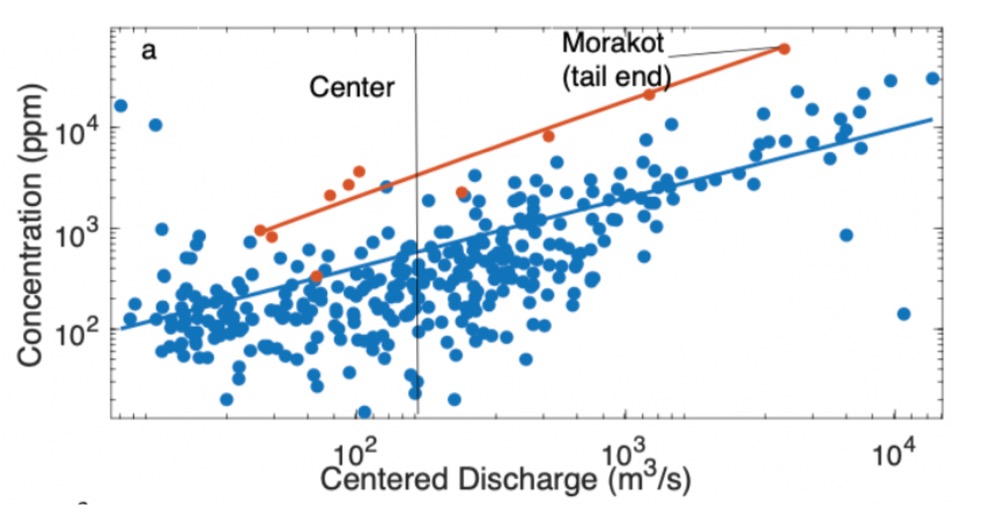
Figure 1. Sediment rating curves pre-Morakot (blue) and post-Morakot (red) for 8/5/2009 – 10/31/2009 in the Gaoping river.
Contributors: Dr. Ken Ferrier and Dr. Gregory Ruetenik (Post-doc)
2. Quantifying Temporal Relations and Seismicity Rate Changes between Wet Cyclones and Subsequent Earthquakes
In this direction of our project, we study spatial-temporal changes of microearthquakes in Taiwan around the 2009 Typhoon Morakot. Because many microearthquakes were missing from the standard earthquake catalogs (especially during and right after Typhoon Morakot), we apply our recently developed Matched Filter Technique (MFT) to systematically detect microearthquakes in Taiwan half a year before to one year after Typhoon Morakot. We use 71 short-period stations in the Central Weather Bureau (CWB) and 32802 earthquakes listed in the CWB catalog around Taiwan as the templates to scan through the ~ 1.5 years of continuous seismic data. So far we have detected 271,129 events (a ~9-fold increase). With double-difference waveform cross-correlation technique, 102,644 events (a ~3-fold increase) can be relocated. The relocated seismicity shows many linear features, highlighting detailed subsurface fault structures at depth (Figure 2). We also find possible changes in Guttenberg-Richter b value after the Typhoon Morakot at the heavy-rainfall regions in Taiwan (Figure 3), where many landslides were triggered by Typhoon Morakot. This is consistent with a recent finding using only the CWB catalog (Steer et al., 2020), suggesting a possible triggering relationship.
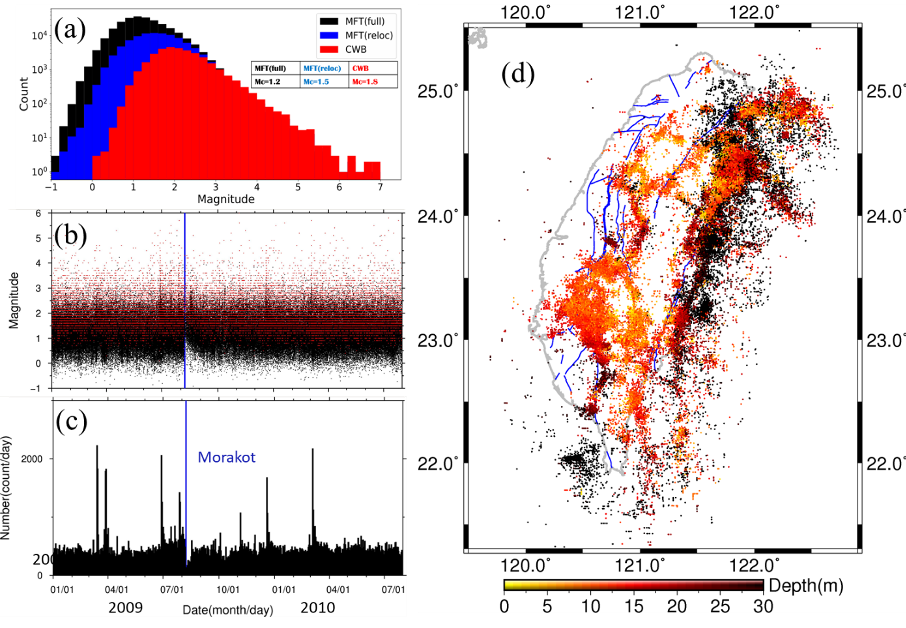
Figure 2. The results of microseismicity detection and relocation around the Typhoon Morakot in Taiwan (01/01/2009-07/31/2010). (a) Frequency-magnitude distribution of earthquakes listed in the CWB catalog, the full MFT catalog, and the relocated subset of the MFT catalog. (b) Magnitude-Time distribution of the CWB catalog (red) and the MFT catalog (black). (d) Daily seismicity rate of the MFT catalog. The blue time line is 08/08/2009 when typhoon Morakot brought heavy rains in southern Taiwan. (d) Map of the relocated subset of the MFT catalog.
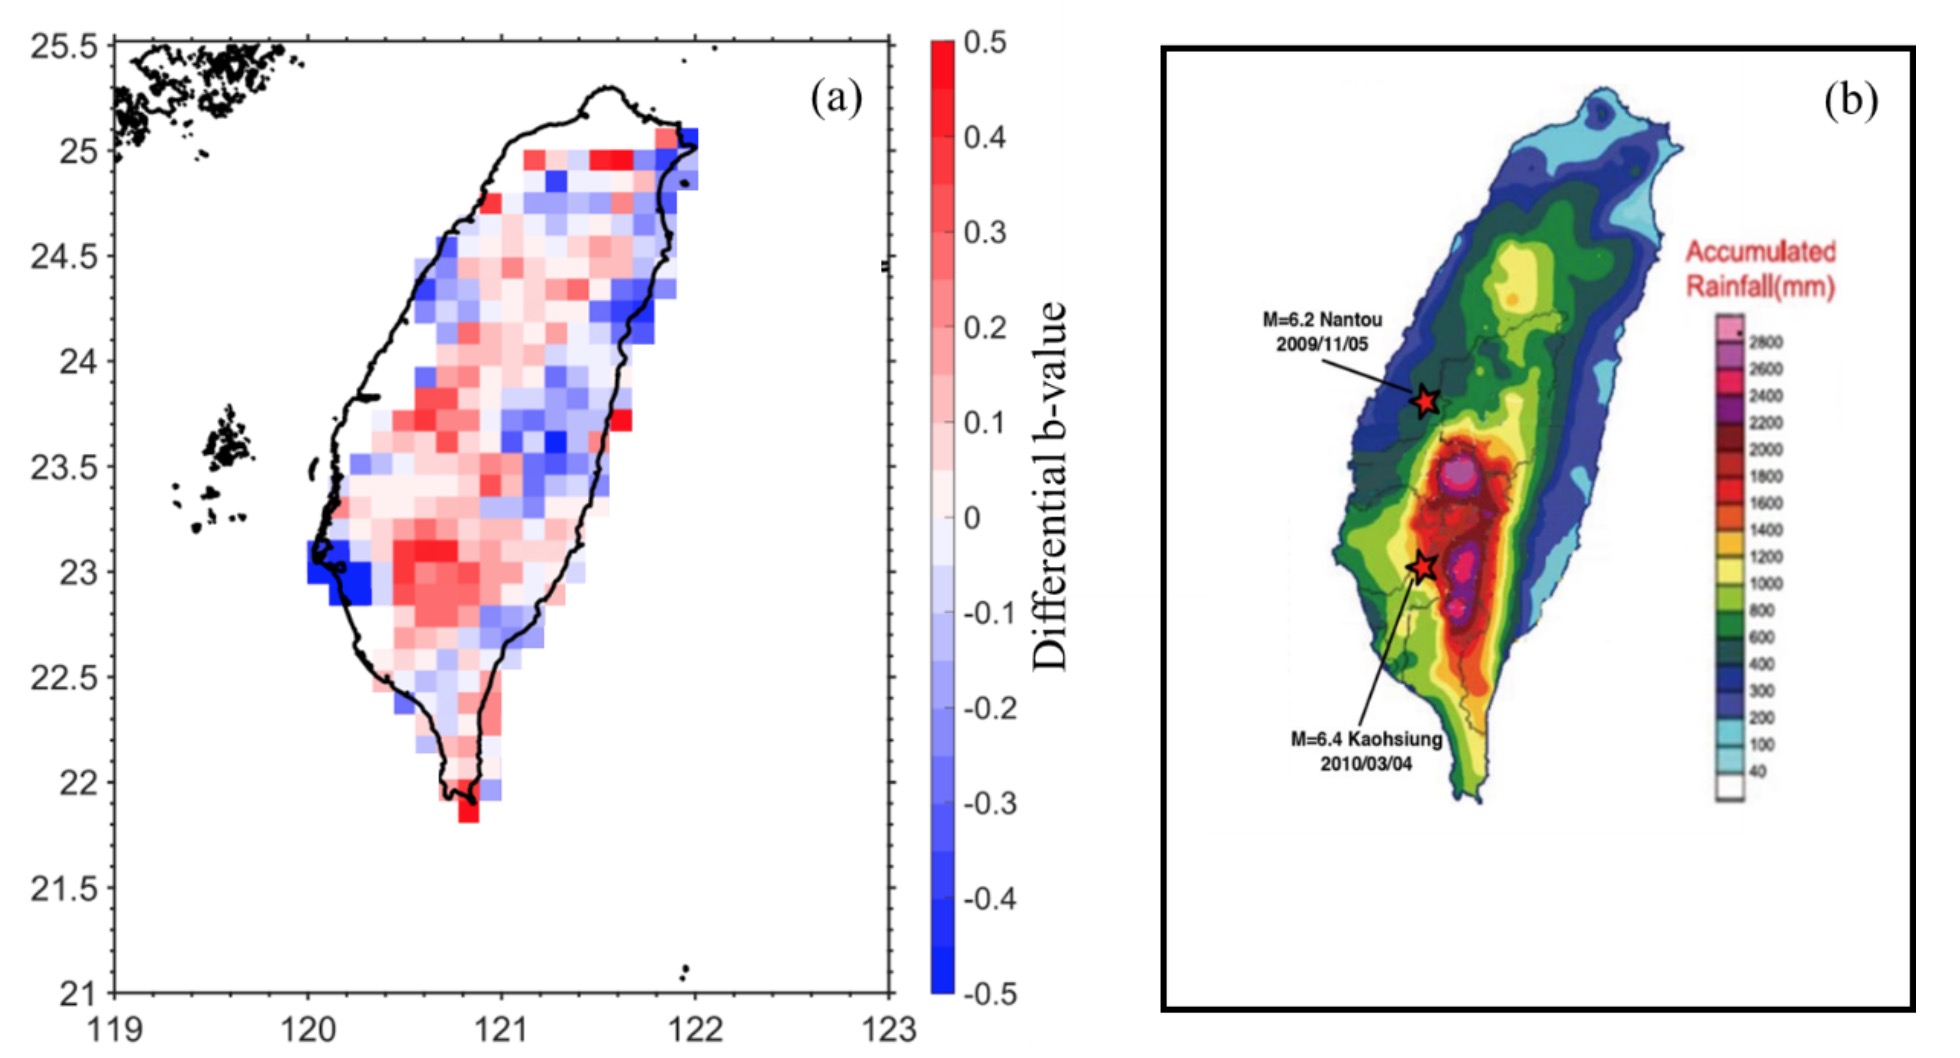
Figure 3. The differential b-value map before and after Typhoon Morakot and the accumulated rainfall during the Typhoon Morakot. (a) Differential b-value map. Period before Typhoon Morakot is 01/01/2009-08/08/2009; Period after Typhoon Morakot is 08/08/2009-07/31/2010. Positive means b value after Morakot is larger than it before Morakot. (b) The accumulated rainfall during the Typhoon Morakot (08/05/2009-08/10/2009).
Reference:
Steer, P. et al. (2020), Earthquake statistics changed by typhoon-driven erosion, Scientific Reports, in press.
Contributors: Dr. Zhigang Peng and his student: Qiushi Zhai
3. Mechanical Modeling of Crustal Stress Change
**** Topic 1: Earthquake Interaction in Central Taiwan ****
Taiwan can be regarded as the product of convergence and subduction-collision processes. Central Taiwan is dominated by mountain building process and has abundant records of seismicity, typhoon, landslides and active faults, etc. It is a great place for us to explore the seismogenic structures and the nucleation mechanism of the moderate-to-large earthquakes. we examined the coseismic Coulomb stress changes due to preceding earthquakes on hypocenters of the Central-Taiwan-Mainshock earthquake sequence, including 14 mainshocks with Ml≥ 6.0, from 1900 to 2017 in Central Taiwan. The source preceding earthquakes included mainshocks in the sequence and other surrounding earthquakes including 3 smaller magnitude mainshocks with 5.5≤Ml≤6.0 and 25 aftershocks with Ml≥ 5.5 (Figure 4). We calculated the Coulomb stress triggering effects by using the Coulomb 3.3 software from USGS (Toda et al., 2011). We found that 5 mainshocks with Ml≥ 6.0 (1964 Baihe in January, 1972 Hualien in November, 1983 Taipingshan in May, 1999 ChiChi in September and 2010 Jiahsian in March) were promoted, where the Coulomb stress change was larger than 0.1 bar. 7 mainshocks (1935 Hsinchu in April, 1941 Chungpu in December, 1946 Hsinghua in December, 1998 Rueyli in July, 2009 Nantou in November, 2013 Nantou in March and 2013 Nantou in June earthquakes) were inhibited to failure, where the Coulomb stress change was smaller than -0.1 bar. Whether the 2016 Meinong earthquake was promoted or inhibited is questionable because: (1) Coulomb stress change on the hypocenter of 2016 Meinong earthquake was 0.101 bar, which was very close to the threshold 0.1 bar, (2) About 33% - 38% of calculated Coulomb stress changes should be considered as uncertainty based on sensitivity analysis of Coulomb stress changes due to multiple parameters (eg, source slip models, receiver fault geometry, location of hypocenter and effective friction coefficient) (Li et al., in revision).
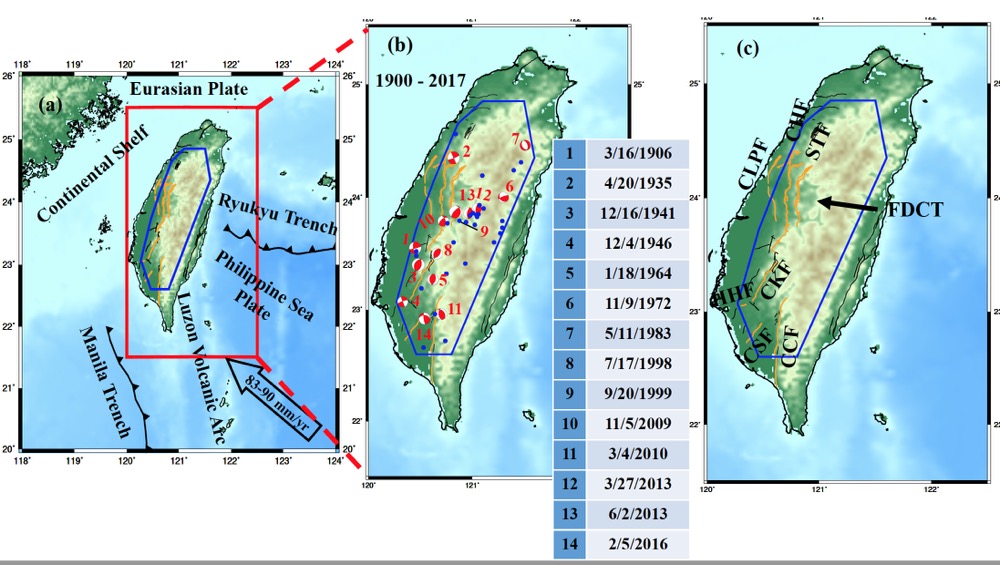
Figure 4. (a) Tectonic Map of Taiwan. The plate convergence rate 83 – 90 mm/yr is from Hsu et al. 2016. (b) Earthquakes and active faults used in this study. The yellow blue outline marks our area of interest. Red beachballs represents large mainshocks with Ml≥ 6.0 from 1900 to 2017 (The Central-Taiwan-Mainshock sequence). Blue points represent surrounding earthquakes with Ml≥ 5.5 including mainshocks. Black lines mark active faults of Taiwan (Hsu et al. 2016) and black bold texts show the active faults studied in this paper. CHF: Changhua Fault; CLPF: Chelungpu Fault; STF: Shungtung Fault; FDCT: Flat Decollement of Central Taiwan; CKF: Chukou Fault; HHF: Hsinghua Fault; CCF: Chaochou Fault; CSF: Chishan Fault.
We also calculated Coulomb stress changes on nearby fault systems to understand stress evolution therein and further to evaluate seismic hazard in Central Taiwan. Results suggested that future large earthquakes can be expected along Chukou fault, Chaochou, Chishan and flat decollement of Central Taiwan (Figure 5). Our findings indicate preceding earthquakes can have strong influence on both the nucleation and rupture propagation of large and moderate earthquakes in Central Taiwan for the past 120 years. (Li et al., in revision).
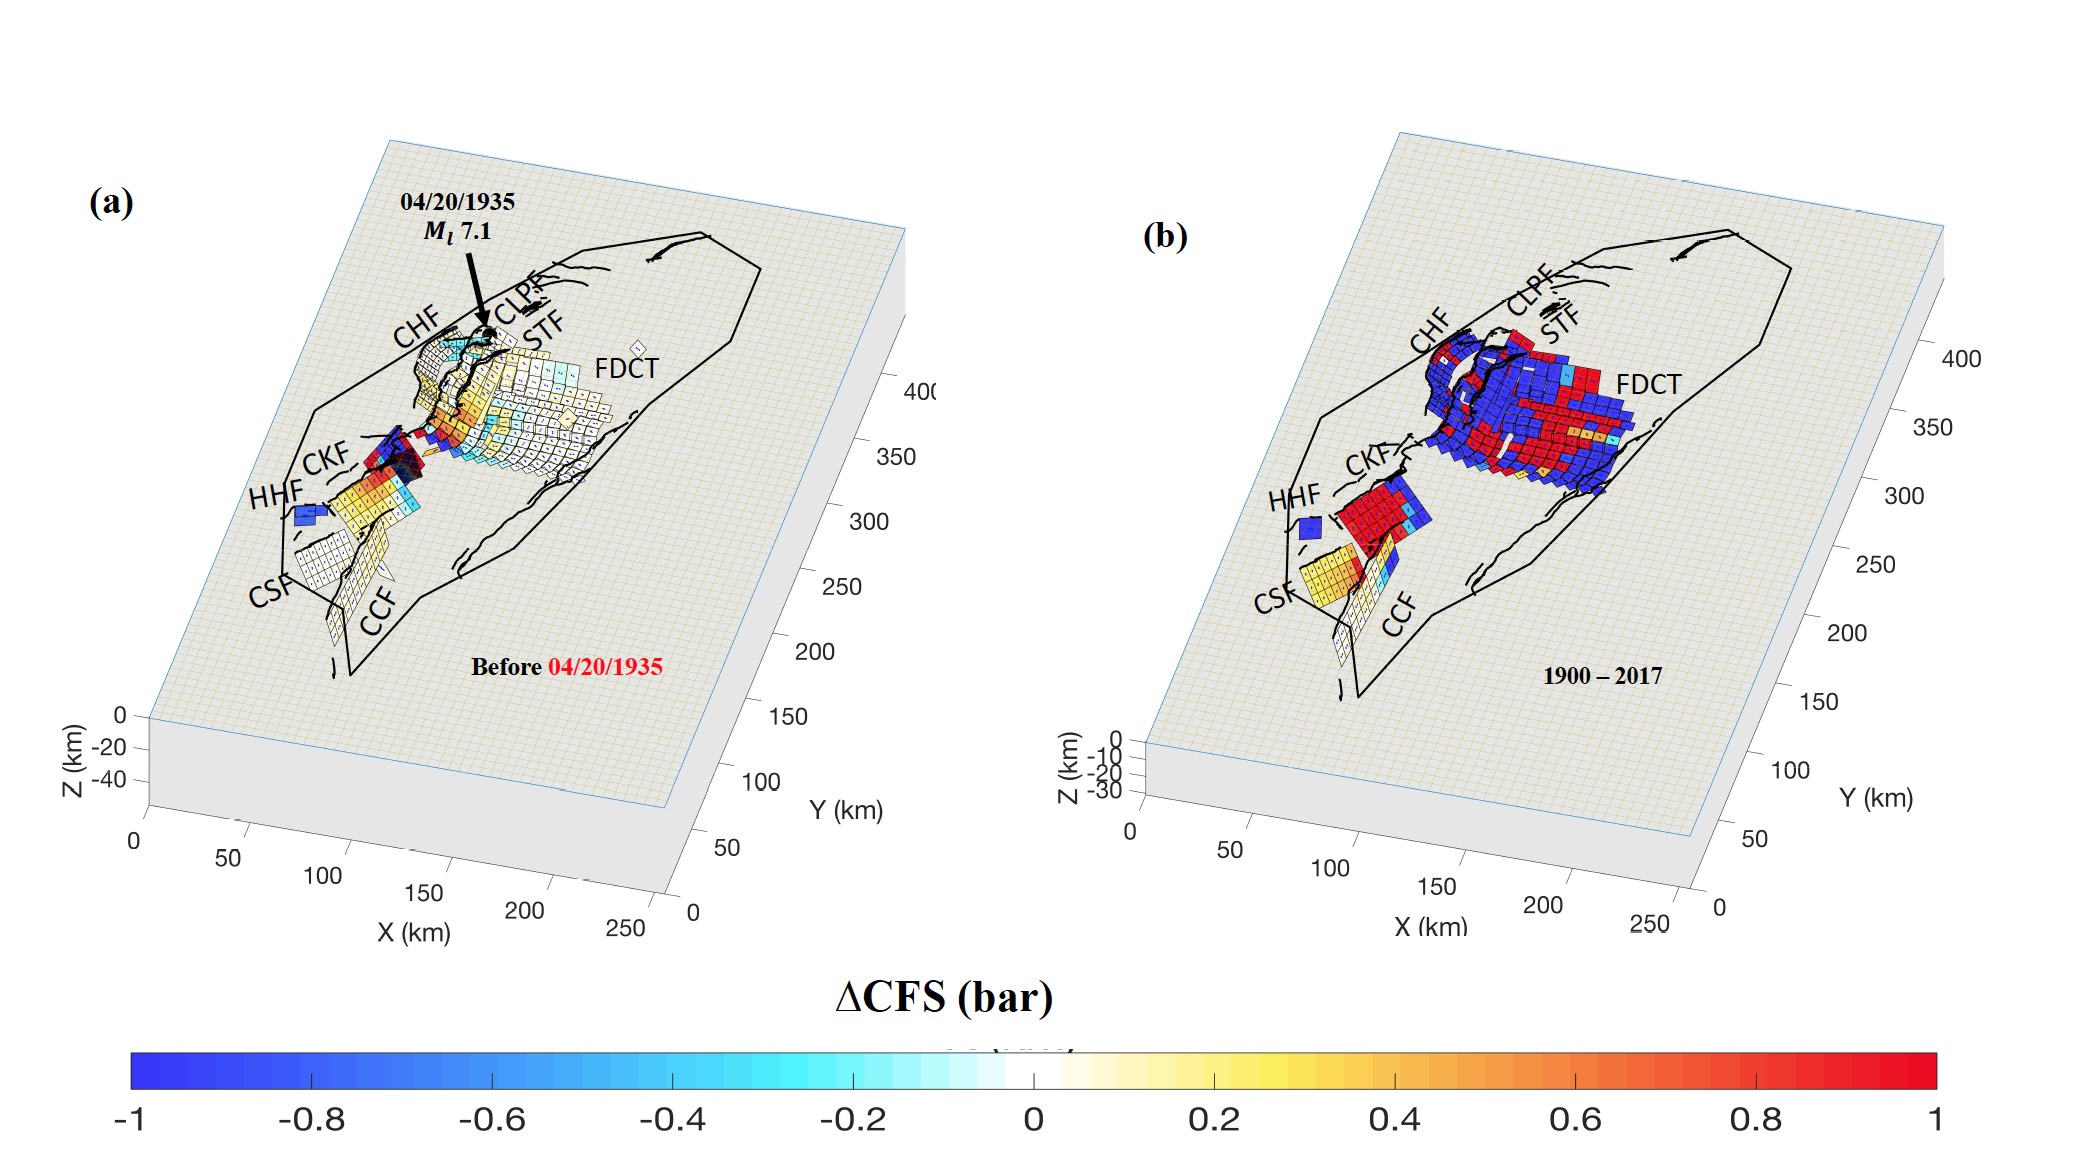
Figure 5. (a) Calculated ∆CFS on the seven pre-defined active faults (Table 2) induced by the coseismic ruptures of preceding earthquakes before the 1935 Hsinchu mainshock occurred. The black dot where a black arrow points to represents the epicenter of subsequent mainshock in the analysis.; (b) Cumulative ∆CFS on specified active faults induced by all preceding earthquakes from 1900 to 2017. CHF: Changhua Fault; CLPF: Chelungpu Fault; STF: Shungtung Fault; FDCT: Flat Decollement of Central Taiwan; CKF: Chukou Fault; HHF: Hsinghua Fault; CCF: Chaochou Fault; CSF: Chishan Fault. The color scale of ∆CFS is chosen between -1 and 1 bar to reflect the significant variation of ∆CFS.
Reference:
Li, S., S. Wdowinski, Y-J Hsu, and B. H. Shyu, Earthquake Interactions in Central Taiwan: Probing Coulomb stress effects due to M_L≥ 5.5 earthquakes from 1900 to 2017, J. Geophys. Res., in revisions, 2020.
Contributors: Dr. Shimon Wdowinski and Dr. Shanshan Li (Postdoc), Dr. Ya-Ju Hsu and Dr. Bruce Shyu.
**** Topic 2: Earthquake Triggering Due to Surface Erosion in Central Taiwan ****
we used the Comsol Multiphysics software package, which is available to FIU users, to calculate the Coulomb stress changes due to surface unloading. Our model consisted of a three-dimensional homogeneous elastic material and solves for the three-dimensional stress field. We estimated rates of mass redistribution based on suspended sediment concentration and water discharge from gauging stations for seven time periods (Figure 6a) based on Typhoon Morokat and Mainshocks after 2009 in Central Taiwan. The numerical model includes an assumed sediment density (2750 kg/m3), Young’s modulus (1e11 Pa) and Poisson’s ratio (0.25). The sides and bottom of the 3D model are set as roller condition here (Figure 6b). Stress and strain are numerically calculated with the Finite Element Method (FEM), using the structural mechanics module in the software Comsol. Erosion Unloading induced Coulomb stress change has been calculated with user specified functions in Comsol on a known fault plane with fault orientations same as mainshocks after 2009 and active faults in Central Taiwan. Our results (Figures 6c and 6d) indicated that: (1) Typhoon Morokat imposed significant effect on surface erosional rates and Coulomb stress change rates at hypocenters of mainshocks; (2) Failure stress changes induced by Typhoon Morokat, at hypocenters of mainshocks are ~267 – 1733 (Pa). For comparison, they are of comparable magnitude to tidal-induced and seasonal water storage-induced Coulomb stress changes (order of 1𝑒3 Pa) (Bettinelli et al., 2008); (3) Total failure stress changes, which were calculated according to the decadal erosion rate starting from 2005, on hypocenters of mainshocks are ~667 – 2039 (Pa) (Li et al., in prep).
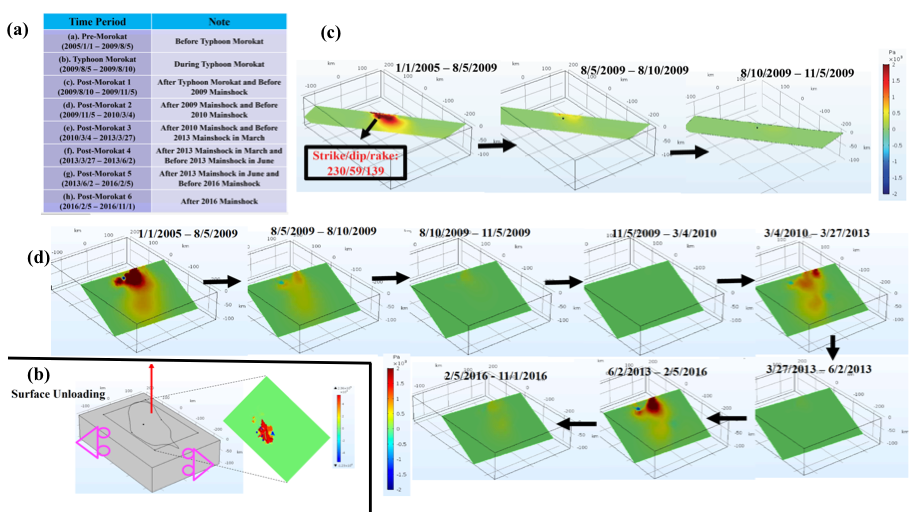
Figure 6. (a) Seven time periods for estimation of the erosional rates. (b) Model configuration for the unloading studies and surface unloading boundary conditions. (c) Coulomb stress change along 2009 Nantou mainshock (11/5/2009) rupture plane due to erosional unloading from 2005 through time. (d) Coulomb stress change along Shuangtung fault plane due to erosional unloading from 2005 through time.
Reference:
Bettinelli, P., J.P. Avouac, M. Flouzat, L. Bolllinger, G. Ramillien, S. Rajaure, and S. Sapkota, Seasonal variations of seismicity and geodetic strain in the Himalaya induced by surface hydrology, Earth
and Planetary Science Letters, 266, 332-344. 2008.
Li, S., S. Wdowinski, G. Ruetenik and K. Ferrier (in preparation), Numerical Modeling of Earthquake Triggering Due to Erosional unloading in Central Taiwan.
Contributors: Dr. Shimon Wdowinski and Dr. Shanshan Li (Postdoc), Dr. Ken Ferrier and Dr. Gregory Ruetenik (Post-doc)